This is a 40+ image album of the state of the card game Magic the Gathering up until 2018.
I start off by looking at the distribution trends for cards, card types, and keywords over the history of Magic. In addition to basic divisions, this also cover divisions like rarities, creature types, creature classes, Power (P)/Toughness (T) trends, and the use of more general "action" words like "Create" or "Sacrifice".
Next, I perform regression analysis (Ax = b, where A are the traits / card, x are the trait values, and b are the card Converted Mana Cost (CMC)) to explore the value of various card traits in CMC.
Said another way, I try to answer the question "how much is a given trait worth in CMC?" ex: Power is currently valued more highly than Toughness with a point of Power ~worth 0.5 CMC while a point of Toughness is worth 0.4 CMC. Both have also been increasing with time. This is done on a per / block basis so that I would have enough cards to do the regression with.
Finally, I look at how the art of Magic the Gathering has changed over time. To do so, I collected samples of the art for every card released and performed what is known as Perceptual Hash Analysis on those cards (www.phash.org)
The basic idea of a perceptual hash is that it compares art / images and gives you a number which represents the distance of those images from one another. For each set in Magic, I then constructed a matrix of all of these distances and then backsolved to find the positions of the images as if they were points in space using a technique called Multi-Dimensional Scaling. Finally, for every art piece, I also averaged the entire art down to a single pixel so see how much correlation the average color had on the "closeness" predicted by the pHash algorithm.
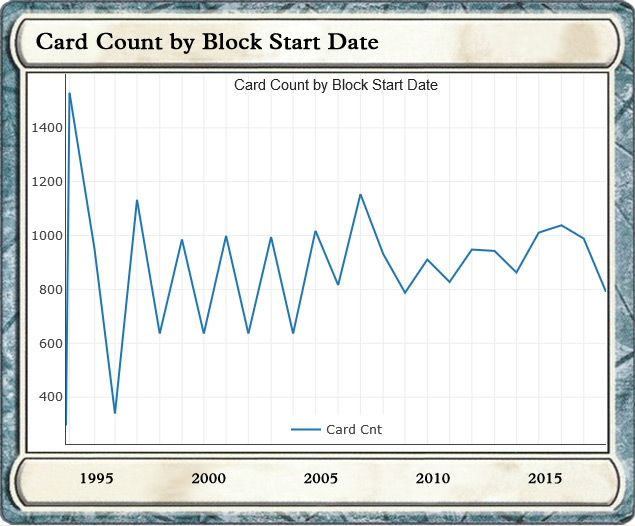
A tally of the # of cards released per block / year over the history of magic. Summation performed from Aug(yr N) - Aug(yr N+1). This puts the yearly set (ex: Magic Origins (ORI, 15, 🎴) or Magic 2015 (M15, 14, 🎴)) as the capstone of the year with a new rotation generally starting Sept-Oct. The choice of which year to put them in is somewhat arbitrary, but this made the cutoff's smoother as the Beta (LEB, 93, 🎴) and 2nd / Unlimited Edition (2ED, 93, 🎴) were the only major sets not released on the pre-Aug side of the year.
2018
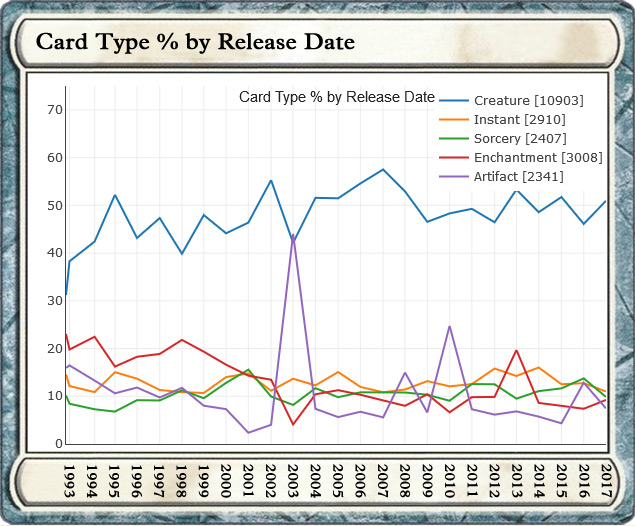
🎴 MtG, Card Type Percentages, by Release Date
🕵🏻
G. C. Putnam
🛈
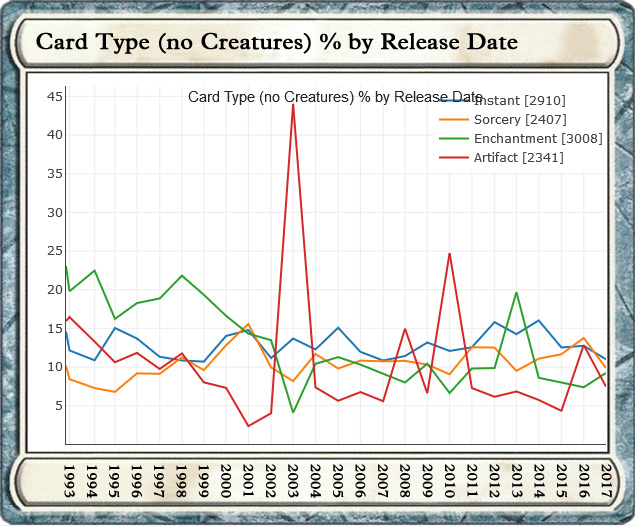
Types of cards that have been released per set as a % of the set. Notable outlier, Mirrodin (MRD, 03, 🎴), which had a Huge number of artifacts. Alara (ALA, 08, 🎴) and Scars of Mirrodin (SOM, 10, 🎴) repeated this to a lesser degree, while the Theros block (THS, 13, 🎴) (BNG, 14, 🎴) (JOU, 14, 🎴), released dramatically larger #'s of enchantments. Creatures have since the very beginning held steady at ~50 % of every block.
🛈
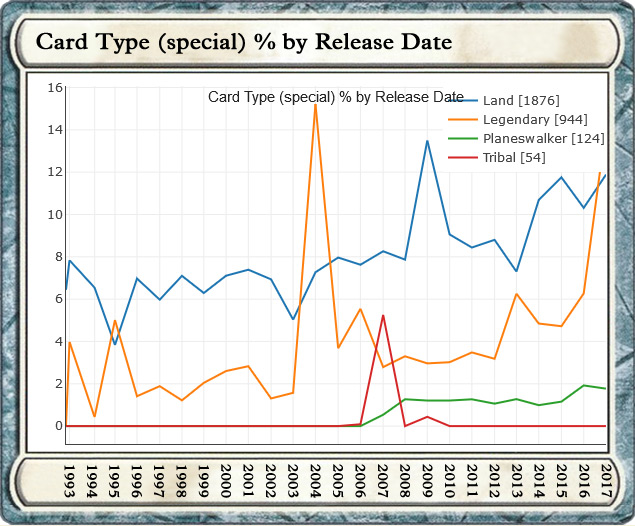
The third images shows types of cards that are common, but less dominant for block percentages, as well as often having crossover with the other types. Lands have interestingly been growing as a percentage of sets, to a point that they now rival most of the lesser main types (Instant, Sorcery, Enchantment, Artifact). Legends had a huge surge in Kamigawa (CHK, 04, 🎴), and have otherwise been on a parabolic rise, while tribals had their single day during Lorwyn (LRW, 07, 🎴) / Shadowmoor (SHM, 08, 🎴), and then were largely absent. Planeswalkers, while dramatically influential in pricing and value, remain a tiny part of most sets.
2018
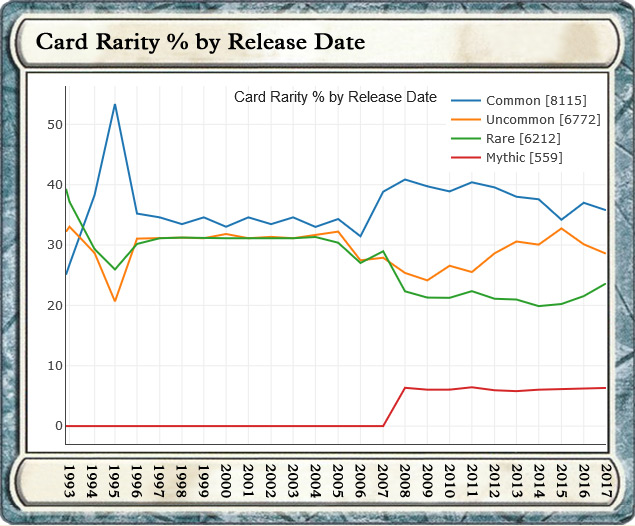
🎴 MtG, Card Rarity, by Release Date
🕵🏻
G. C. Putnam
🛈
For a long time, each of the three rarities got about 1/3 of a set until ~2006-2007. Around that time, with the addition of Mythics, Commons actually rise as a percent, while Rares effectively just split their total with Mythics.
2018
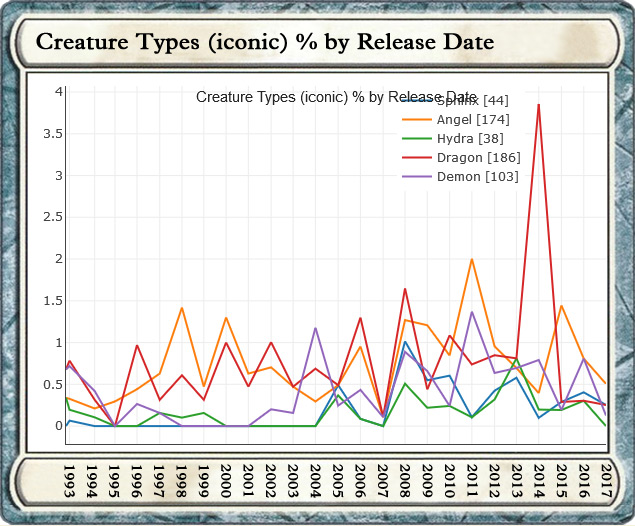
🎴 MtG, Creature Type Percentages, by Release Date
🕵🏻
G. C. Putnam
🛈
Six (6) charts looking at the distribution of creature types among cards released, with the first being iconic creatures. The two winners here are obviously Dragons and Angels, yet while Dragons appear to be far more prominent, they actually only edge out Angels by 12 total cards. In truth, the Iconic types as a whole really see very little use for being "iconic" and both Sphinxs and Hydras are in drastic need of some attention. Surprising too, considering many Hydras have actually been very influential on their blocks (ex: Prime Hydra, Progenitus)
🛈
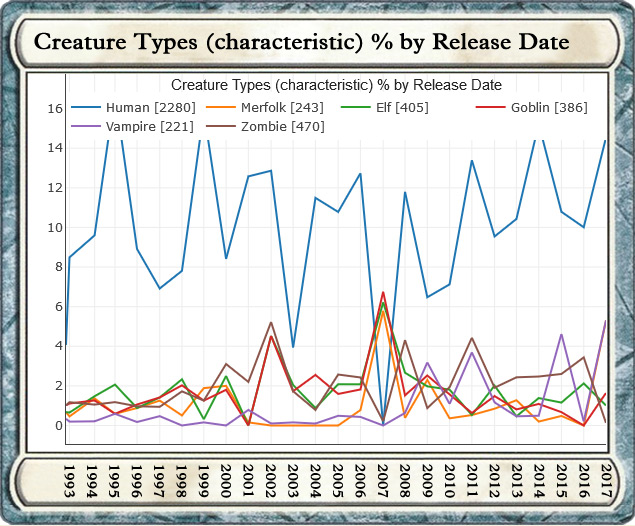
Next with characteristic creatures, it is little if not a human-centric world. They are far and away the most used type in magic only playing second fiddle in a couple of sets like Kamigawa (CHK, 04, 🎴) (spirits) and Lorwyn (LRW, 07, 🎴) / Shadowmoor (SHM, 08, 🎴) (tribal). In Lorwyn / Shadowmoor they are effectively replaced by their fractured counterparts from the Tribal groups.
🛈
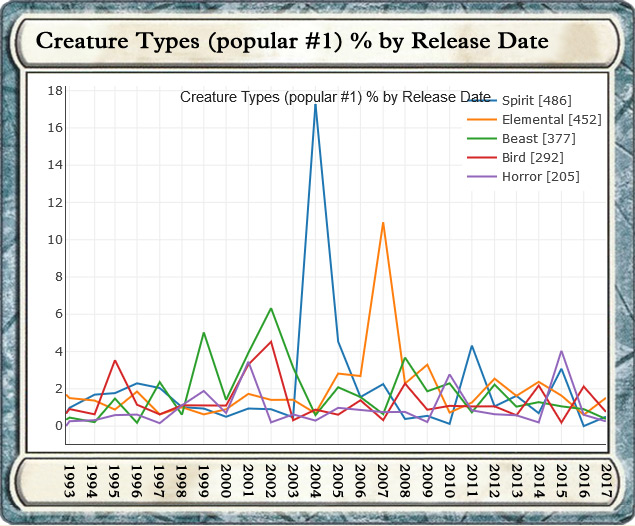
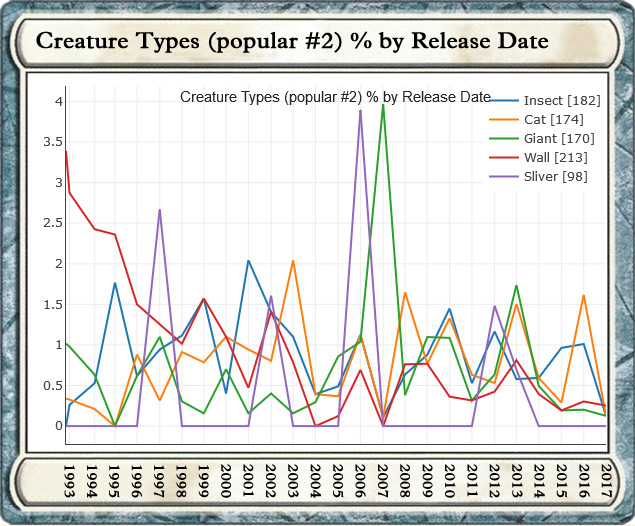
The leftover types which are still popular and include at least 200 cards over magic history, which puts them above the "iconic" types in count. Other than the aforementioned Spirits / Elementals, Beasts are the other major group which got a lot of attention early in Magic (Masques (MMQ, 99, 🎴) / Onslaught (ONS, 02, 🎴)), and then largely faded from view. The second "popular" chart showing creature types with equal or less representation than the "iconics". Once again, Lorwyn / Shadowmoor is the source of a big spike (Giants) as well as its predecessor Time Spiral (TSP, 06, 🎴), when the Slivers came a calling. Walls used to be all over the place, but I guess we've been breaking down barriers, as they've almost completely vanished.
🛈
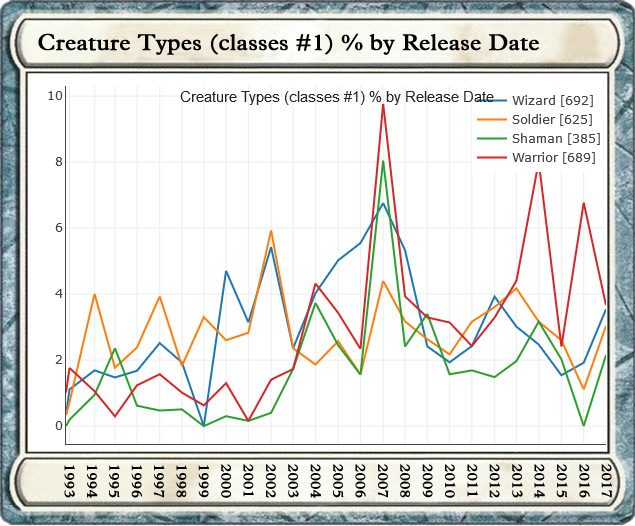
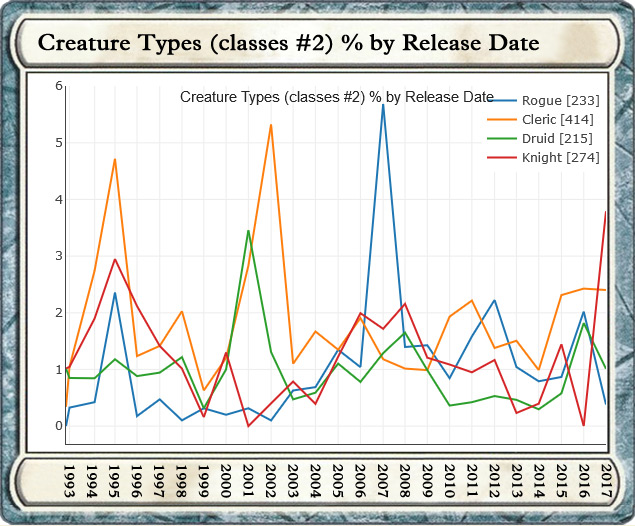
The final two charts show the second half of the major division for creatures, which is their "class" or occupation. Amusingly, the time when there was the most diversity of jobs was when there were the least Humans. Warriors have also been seeing a big surge lately with Khans of Tarkir (KTK, 14, 🎴) and Kaladesh (KLD, 16, 🎴) / Amonkhet (AKH, 17, 🎴) to the point where they now outnumber Soldiers (a long time leader). The final chart being the lesser used classes (notably, Cleric should actually be swapped with Shaman, having a lot of early use and steady later inclusion at ~2% / set) Oddly, Druids and Shamans are not particularly correlated, with the only really big set for Druids being Odyssey (ODY, 01, 🎴). The flower of Knighthood almost completely disappeared from the world, but has returned with a vengeance in the last year.
2018
🎴 MtG, Card Keywords, by Release Date
🕵🏻
G. C. Putnam
🛈
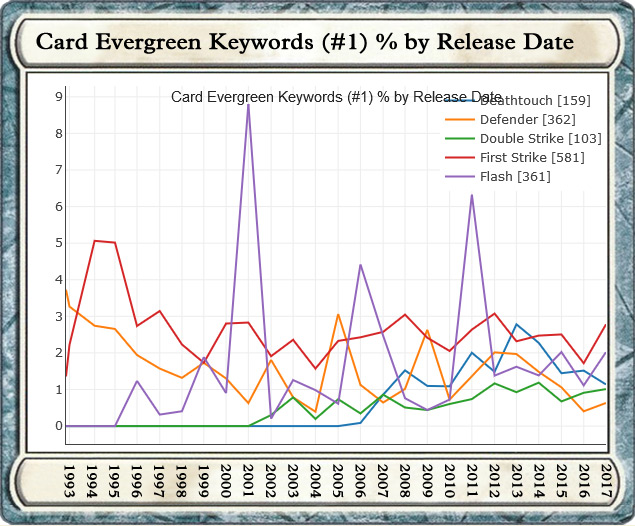
Five (5) charts that look at cards which include the use of a keyword in the main text, organized alphabetically. First three are Evergreen keywords, where notably spikey is Flash, which tends to have about a 6 year period between bursts, and Defender which has close to a 3 year period. (Reddit commenter "Qualdrion" noted that Flash may also included parts of "Flashback" for some inaccuracy.) In this group, First Strike is easily the most consistent, rarely dropping below 2%.
🛈
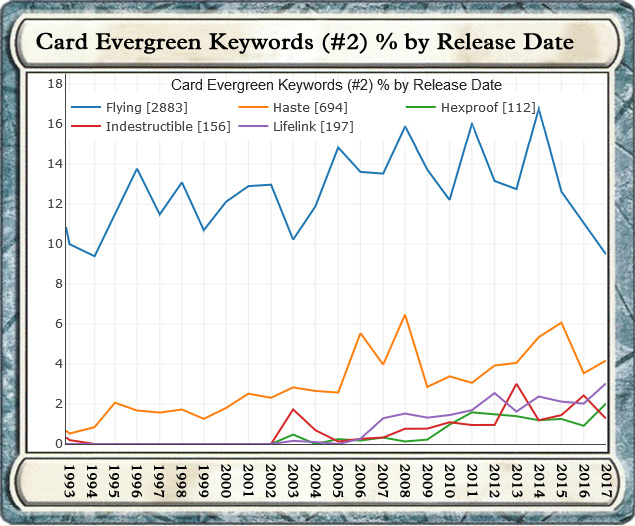
Among the second chart, easily the most used Evergreen keyword in all of magic, Flying almost never drops below 10% in a set, and has been above 12% much of its life. Likely, as it is a steady form of evasion with numerous counter moves available. As we'll see in later graphs, this also gives it one of the most consistent valuations of a keyword. However, Haste is also quite consistent, and has apparently met with approval, as it has been on a consistent rise over time. In addition to being a hallmark for Artifacts, Mirrodin block (MRD, 03, 🎴) (DST, 04, 🎴) (5DN, 04, 🎴) is also notable for being the genesis of numerous long lived keywords like Lifelink, Indestructible, and Hexproof.
🛈
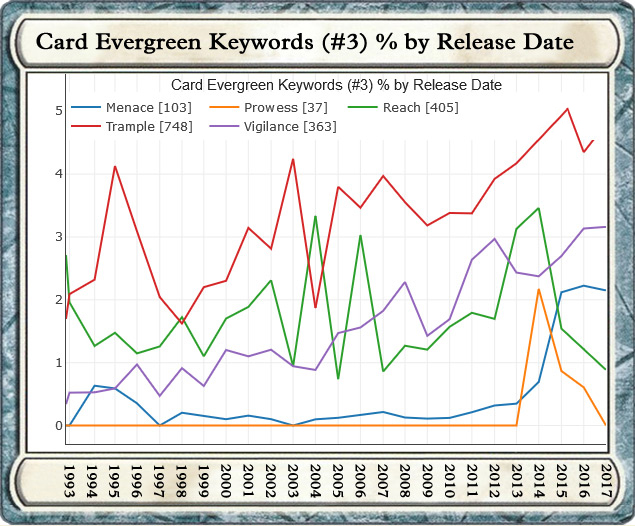
The last of the Evergreen keyword charts, this illustrates particularly well the longevity of two green keywords, Trample and Reach. Trample has been with us since the beginning and has generally received upward inclusion in each block with notable outliers in Homelands (HML, 95, 🎴) (high) and Kamigawa (CHK, 04, 🎴) (low). Reach is an interesting case, as like Defender, it tends to be a keyword that offsets card value, and been decidedly more spikey in its use, featuring strongly in Kamigawa and Time Spiral (TSP, 06, 🎴), then taking a major break until Theros (THS, 13, 🎴) and Khans (KTK, 14, 🎴). At the time of 2018, the story for Prowess did not appear to be very good, as it was heavily used for about two sets, but was effectively in freefall ever since.
🛈
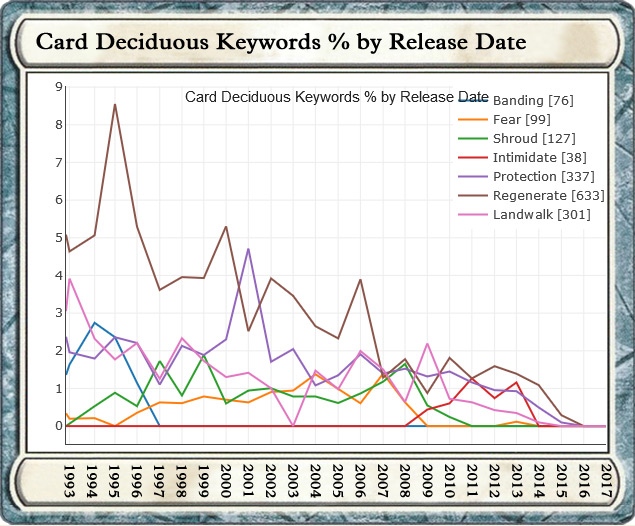
Usage stats for all of the Deciduous keywords (keywords that R&D has not ruled out, but says are unlikely in the future. Reddit commenter "JimHarbor" noted many are mostly deprecated.). The graph tends to support this, as it is evident that nearly every one of these keywords started out strong and has been slowly phased out over time. Regenerate in particular is a surprising example of this trend, as at one point it was the second most popular keyword after Flying. Protection at one point was also heavily used (Odyssey (ODY, 01, 🎴)) but got culled like the rest. Theros block was when the big change to remove most happened, with the phase out happening over the next two years until Battle for Zendikar (BFZ, 15, 🎴). However, most (excluding the highly confusing "banding") had been on the decline for a long time.
🛈
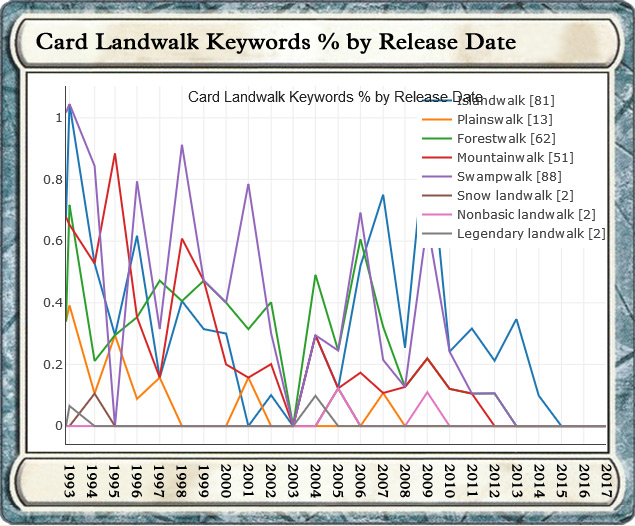
Finally, a quick look at the split for all the types of landwalk in the game, as it actually had a huge amount of diversity for such a rarely used ability. 8 major types with Swamp and Island being the big players, and Plains being the least used. This surprised me a bit, as I mentally always tallied Forestwalk as more influential due to its presence in many Elfball style decks.
2018
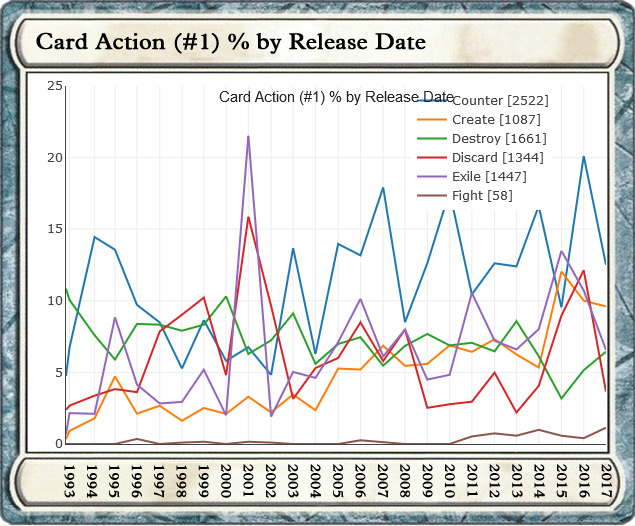
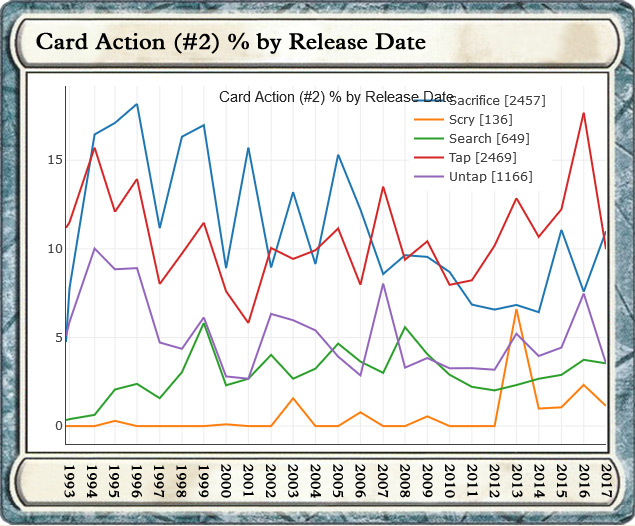
🎴 MtG, Card Actions, by Release Date
🕵🏻
G. C. Putnam
🛈
Two (2) charts looking at Actions which can be taken by cards. Notably, Counter is a difficult case to filter, as this stat includes both cards that add "counters" to objects as well as cards which "counter" a spell. A difficult crossover of terminology. Removal effects (Destroy / Exile) are considerably more prominent than Create, but this make sense, as most spells when cast tend to "create" something. Although I focused on Discard, a notably absent action is Draw, which would likely have similar numbers. I didn't play the block, yet Odyssey (ODY, 01, 🎴) was obviously something of an outlier, as it once again features a huge spike in otherwise less commonly used terms and words (Exile / Discard) which have only recently returned to prominence.
🛈
Sacrifice used to be the darling of Magic the Gathering, featuring on more cards than even Flying, but has been in steady decline since the start. Part of this probably stems from the sheer number of infinite combos spawned through Sacrifice outlets. In the stats for Tap and Untap, the numbers for Tap should be significantly lower, as they overlapped with the values for Untap (regex patterns which see both)
2018
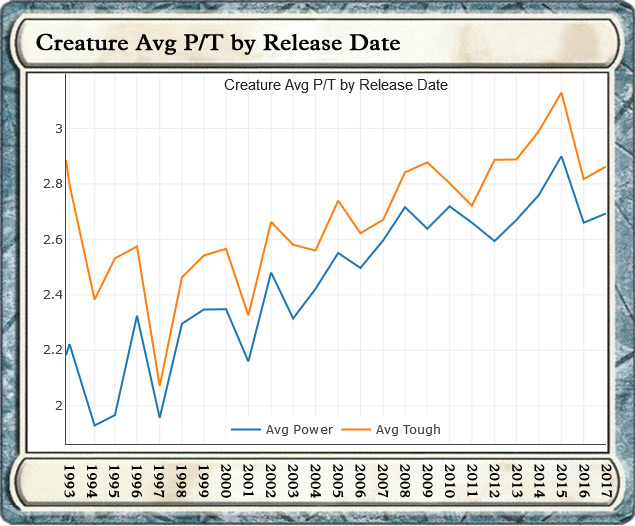
🎴 MtG, Creature Power / Toughness, by Release Date
🕵🏻
G. C. Putnam
🛈
Two (2) charts looking at creature Power and Toughness trends. Looking at the average power and toughness its interesting to see that a) the average for both has steady risen over time, b) they nearly perfectly parallel each other's movements, and c) show no sign of plateauing (ie: the curvature has yet to start turning downward.) Apparently its just an escalating arms race where new stuff has to be a little bit stronger / tougher than old stuff. (Reddit commenter "Ulthran" noted: "AVG P/T was growing since the beginning, especially since 2003, and since 2003 average mana cost is the same or lower than it was. Plus we know that many abilities are being sticked to creatures now.") This is approximately 8th Edition (8ED, 03, 🎴) onward.
🛈
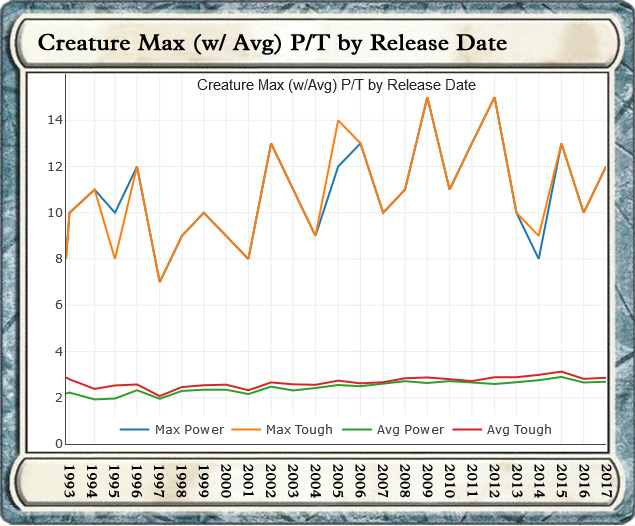
Looking at the max values for power and toughness, the trend is similar, although the maxima are actually surprisingly aligned, with all but three blocks having the maximum P/T be identical over 25 years. This arms race does appear to have slowed down though, as after 2012, the escalation in max values has been curving downward, which may mean the averages will start to do the same.
2018
🎴 MtG, Converted Mana Cost (CMC), by Release Date
🕵🏻
G. C. Putnam
🛈
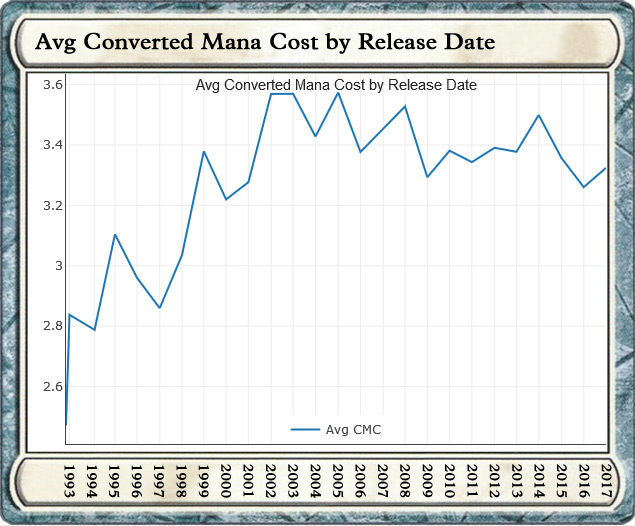
Four (4) charts looking at Converted Mana Cost (CMC) trends with time. While P/T have consistently risen over time, avg CMC found its ideal value of ~3.4 around 2002 Onslaught (ONS, 02, 🎴) and has stayed that way ever since.
🛈
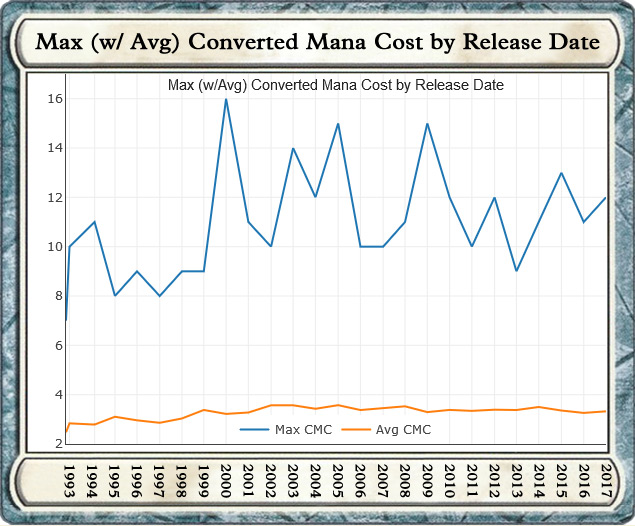
Max CMC follows a similar trend as the average, with the high mark hitting during 2001 Planeshift (PLS, 01, 🎴), Draco, and most sets oscillating around ~12 max CMC after that point. Very spikey though by comparison, swinging from 10 to 15 depending on the Set, while Avg only oscillates 0.2 between Sets.
🛈
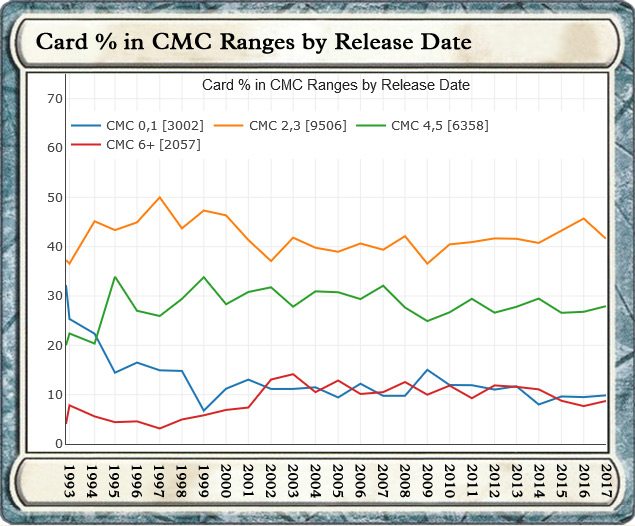
Moving onto how CMC's fall into cost bands, the biggest groups are by far 2-3 and 4-5. On either side of this CMC plateau, most other cards make up only ~20% of any given set. Effectively, this is close to a Gaussian distribution with a center near 3, and a lopsided long tail for larger CMCs.
🛈
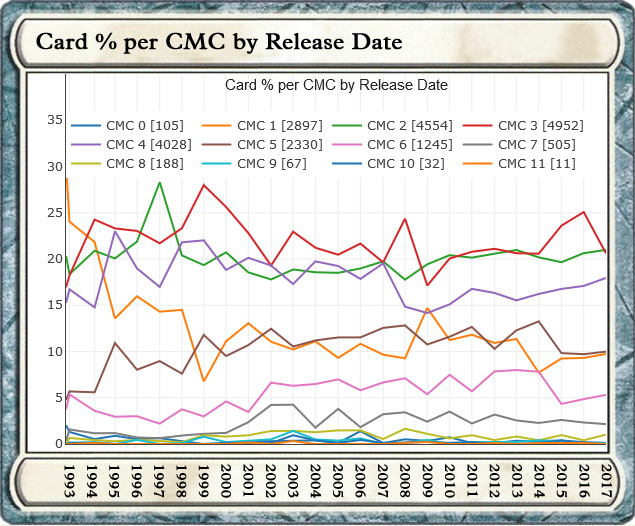
This ~Gaussian distribution can be seen more clearly when we look at individual CMCs per set, with nearly 60% of all cards falling into either CMC 2 (~20%), CMC3 (~20%), or CMC4 (~< 20%). Surprisingly to me, CMC1 and CMC5 are roughly equal, with contributions dramatically falling above CMC5. Personally, I thought there would be more CMC1 cards to allow for ramping into a strategy. Yet, CMC1 cards were common in Alpha (LEA, 93, 🎴) / Beta (LEB, 93, 🎴) and then plunged in number all the way until 1999. CMC2 had a big year in 1997 (~30%), and then fell to <~20% afterward, while CMC3 had a big year in 1999, and then oscillate around 20% of most releases.
2018
🎴 MtG, Value of Concepts in Converted Mana Cost (CMC), by Release Date
🕵🏻
G. C. Putnam
🛈
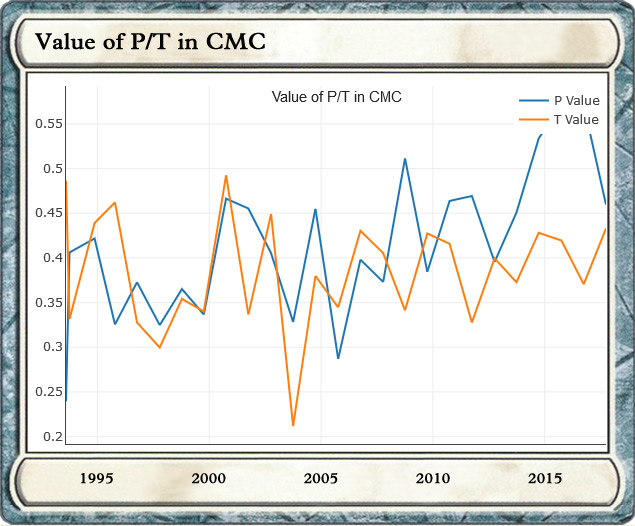
In the next set of eight (8) graphs, I have used regression analysis to solve Ax=b to find the values in mana for properties of cards. A is a matrix made up of the value of attributes (such as a creature's P/T #'s) and binary 0/1 values for whether it possesses Keywords or Actions, x is the value we are trying to solve for, and b is the known card CMC. Using Singular Value Decomposition, I find the least squares inversion of A and solve for x. One way to think of this is "how much does one point of P/T cost in mana from set to set?" In general, you could say the value for P has been getting slightly worse over time, with the current cost sitting at ~0.5, while one point of T only costs about 0.4.
🛈
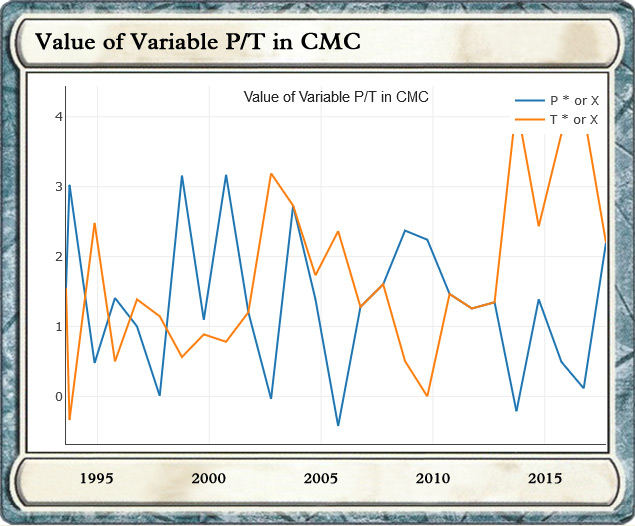
A similar question for the value of a Variable P/T on a creature (x or * in its stat block) with the average value of such a stat sitting at ~2 mana points. Notably, variable T seems to be the more costly option (particularly in recent years) rising to a premium of 3-4 points.
🛈
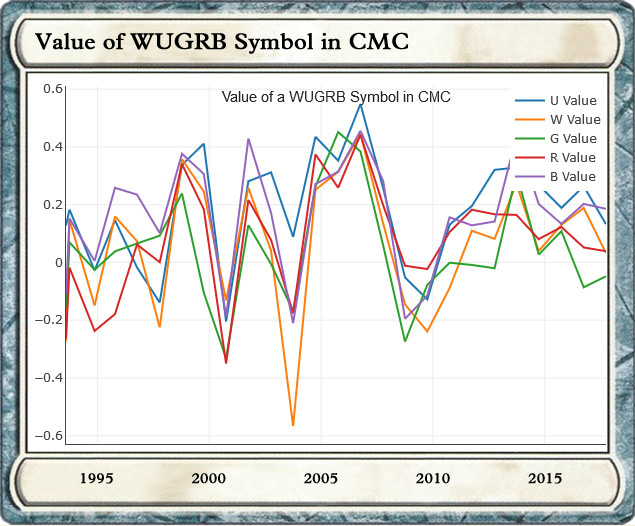
For the third graph, the idea was to see how a Mana Symbol (or multiple) in the cost of a card affected its value (vs just being 1 mana). In these graphs, if the number is 0, the symbol is worth 1 mana, if positive (+), the symbol is worth extra mana, and if negative (-) it actually applies a cost increase (ex: from 2005-2007, each mana symbol, no matter the type, netted you ~0.4 reduction in the overall CMC of a card) Blue and Black tend to be the winners in this dept, as they more consistently give CMC reductions, while White shows decidedly worse performance during a few key years. The Invasion Block (INV, 00, 🎴) (PLS, 01, 🎴) (APC, 01, 🎴) and Mirrodin block (MRD, 03, 🎴) (DST, 04, 🎴) (5DN, 04, 🎴) (and a lesser extent Zendikar Block (ZEN, 09, 🎴) (WWK, 10, 🎴) (ROE, 10, 🎴) / Scars of Mirrodin Block (SOM, 10, 🎴) (MBS, 11, 🎴) (NPH, 11, 🎴)) were noticeably bad, with the usual discount actually turning into a cost increase. Apparently artifact planes are really bad for rainbow mana.
🛈
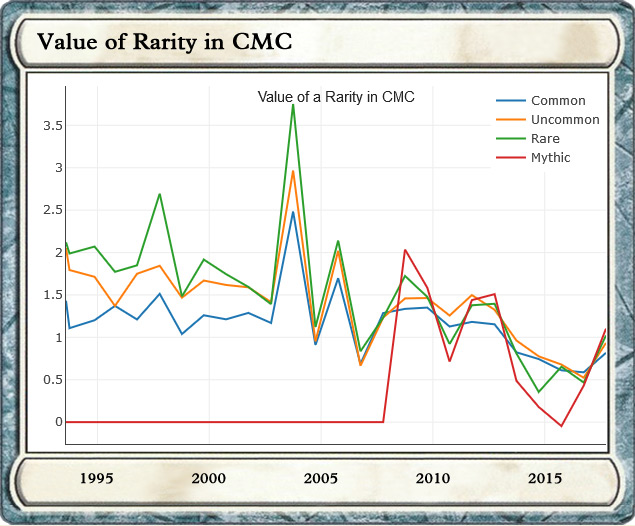
A lot of that cost reduction for Mirrodin was instead taken up by Rarity. However, since all three rose in tandem, it just means that the influence of Mana relative to Rarity changed dramatically. Historically, the discount was fairly obvious, with Rares, then Uncommon, then Common costing the most CMC. Rarity was supposed to cost a bunch. However, after Mythics were introduced in 2008, the script flipped. Now Rares and Mythics actually gave a CMC discount, making them often "better" than normal cards. This wasn't usually severe, with a notable exception being Mythics during 2015-2016 (Battle for Zendikar (BFZ, 15, 🎴) / Shadows over Innistrad (SOI, 16, 🎴)), where Mythics were ~0.5 CMC cheaper than comparable Commons / Uncommons.
🛈
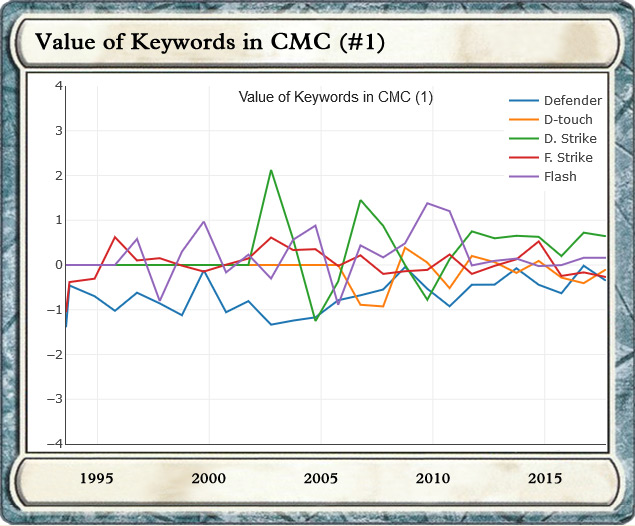
The next three look at Keywords. Notable trends include the consistent cost discount applied by having Defender on a card (~1 CMC) and the surprising cost-discount of Deathtouch, whose CMC value actually tends to be negative.
🛈
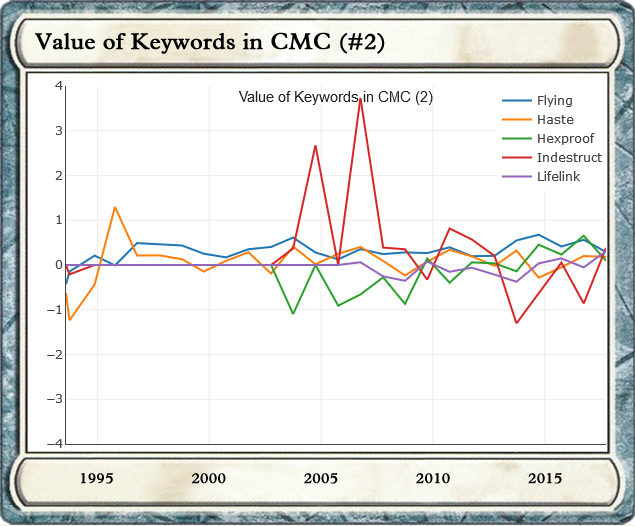
The most heavily used of the Keywords, Flying, also tends to be one of the most consistently high valued, worth about 0.5 CMC on any card for its evasion. For being such a desirable property, Hexproof actually tends to be available at a CMC discount in many early years, with some initial cards severely under-costed. Indestructible is perhaps the most swingy of all the keywords, being heavily over-costed when it first came out (Kamigawa (CHK, 04, 🎴) 8CMC Myojin's and divinity counters anyone?), and then actually transitioning to a discount in later years.
🛈
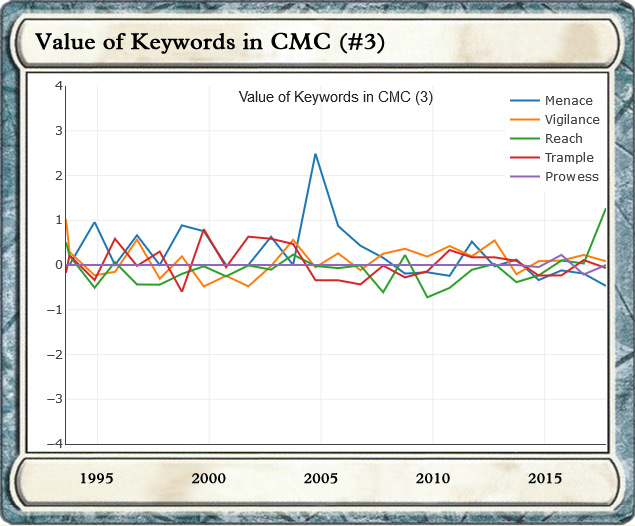
Almost all the rest of the Keywords in the third Keyword graph have ~0 actual CMC cost or discount when included (oscillating between +/- 0.5) with the exception of Menace, which for a short time was a dramatically over-costed form of evasion.
🛈
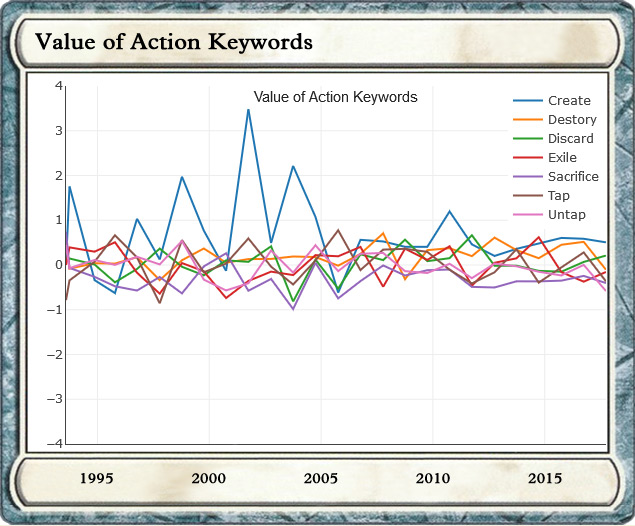
The final chart looks at Action words. Despite their heavy use, few of the Action words actually apply very much CMC cost to creatures when they are added, with the exception of Create, which has generally been at least as valuable as Flying, if not dramatically moreso during the early years of Magic.
2018
🎴 MtG, Value of Concepts Summary and Error, by Release Date
🕵🏻
G. C. Putnam
🛈
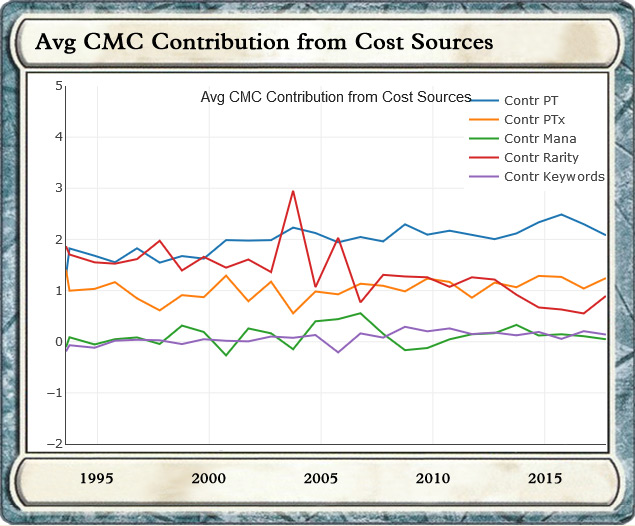
Two final graphs summarizing CMC contributions and errors in predictions. The first looks at the contribution of various components using the prediction methods above to give a sense of scale. By far, the biggest contributors are P/T (either static or variable) followed by the Rarity of the card. Since all the Rarities actually follow closely in lockstep with one another, and have been declining over time, this means that P/T is really the largest contributor that varies significantly. In one sense, most Keywords, and Mana Symbols actually have very little impact on card costs OR those costs effectively have already been taken into account as a "baseline" for cards. (ie, it is expected most cards will have 1-2 mana symbols and 1-2 keywords, with the outliers being exceptional)
🛈
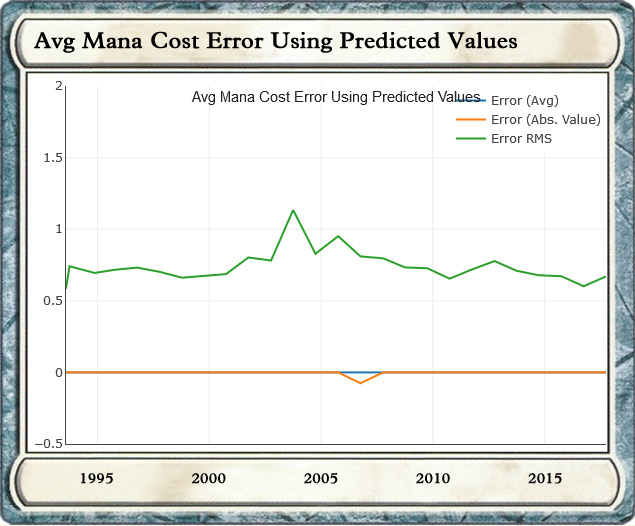
This graph looks at how much the predictions of creature value miss the actual value of creatures when I calculate A * x = CMC(predicted) vs CMC(actual). Error avg just takes all the errors and averages them, Error abs takes their absolute values, while RMS is the Root-Mean Square error, which squares and then square roots each error and then averages. RMS is probably the most representative and most commonly used in statistics papers with usual error being about 0.75 CMC.
2018
🎴 MtG, Perceptual Image Distributions
🕵🏻
G. C. Putnam
🛈
For these last sets of graphs, I wanted to look at how the art of Magic the Gathering has changed over time. To do so, I collected samples of the art for every card ever released and performed what is known as Perceptual Hash analysis on those cards (www.phash.org and WP: Perceptual Hashing)
🛈
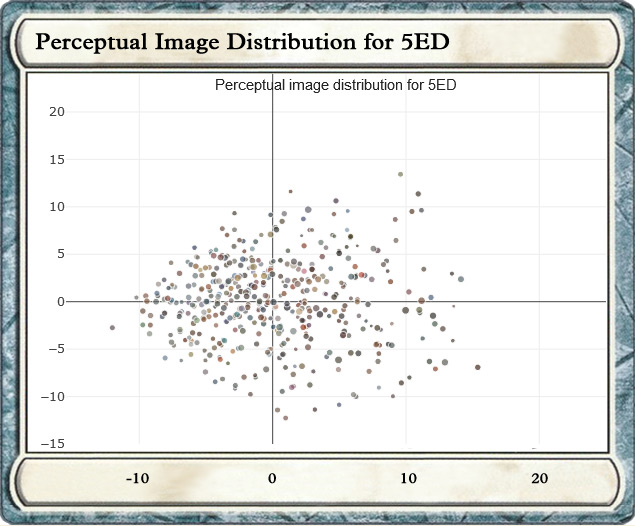
The basic idea of a perceptual hash is that it compares art / images and gives you a number which represents the distance of those images from one another. For each set in Magic, I then constructed a matrix of all of these distances and then backsolved to find the positions of the images, as if they were points in space using a technique called Multi-Dimensional Scaling. The points were given three degrees of positioning freedom with X being the primary degree, Y being secondary, and Z being tertiary. While this was performed for every set, I have only included six examples for sake of brevity and to highlight interesting trends. Finally, for every art piece, I also averaged the entire art down to a single pixel so see how much correlation the average color had on the "closeness" predicted by the pHash algorithm. Short answer, not much.
🛈
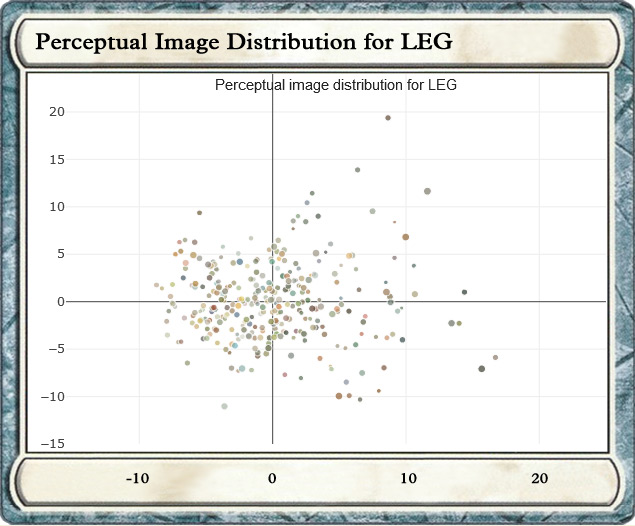
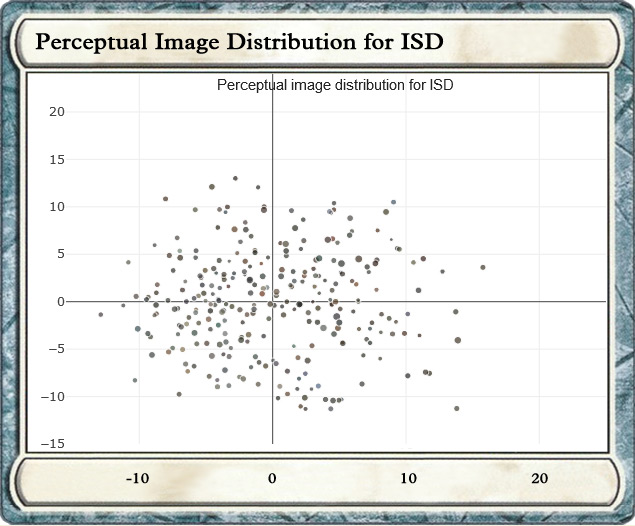
A notable trend in color with Magic is that sets have been getting perceptibly darker over time. Legends (LEG, 1994, 🎴), was perhaps the most "pastel" set ever released, and Magic has rarely ever returned to that level of colorfulness. With later sets like Innistrad (ISD, 2011, 🎴) and Shadows over Innistrad (SOI, 2016, 🎴), the sets are damn near black. Amusingly, what was apparently one of the worst sets for the Gatewatch "heroes", as big-bad Nicol Bolas succeeded was actually one of the brightest / happiest sets in the art, while every set the Gatewatch feature prominently in has been dark, dark, dark. Makes you wonder who the "good" guys actually are? Or perhaps, it's all actually rather evil in Magic the Gathering land, and heroic folks are not much liked.
🛈
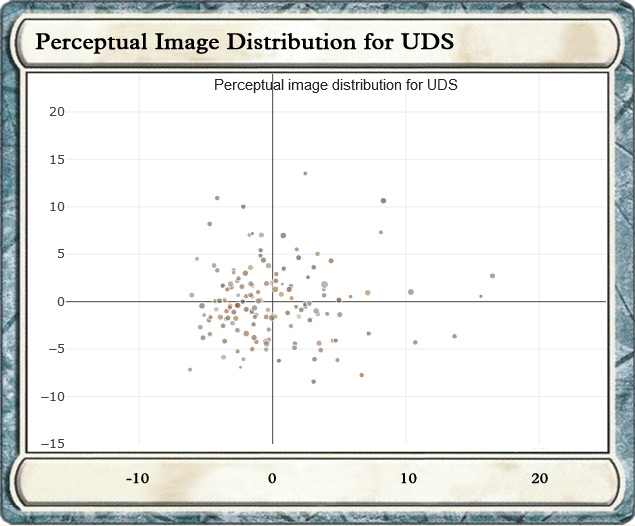
Most main releases, like 5th Edition (5ED, 1997, 🎴) tend to have a primary blob of similar art with an extended halo of art with more variety. Expansions, "usually" seem to have much less concentration and more variety all throughout. From the Perceptual Hash algorithm's perspective, Urza's Destiny (UDS, 1999, 🎴) is perhaps one of the most uniform art style expansions. Most sets have a +/- 10 range, Urza's Destiny has few outliers beyond +/- 5. Looking back over the art to check, a lot of the art is very similar, with head and shoulder's portraits featuring heavily.
🛈
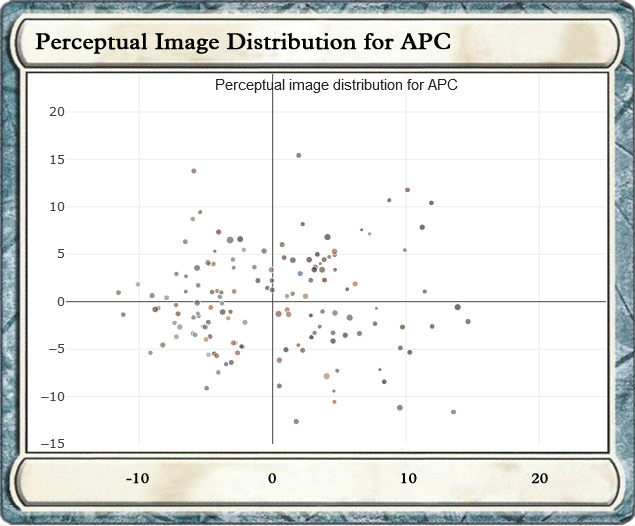
Apocalypse, (APC, 2001, 🎴), is included being one of the most scattered / varied art sets ever made, with even the center of mass of the cloud having few-to-no contributing images, and very little clumping of art otherwise.
🛈
As noted earlier, Innistrad, and Shadows Over Innistrad, are dark to the point of nearly black. Its surprising looking back on it, as most cards barely even have another color besides black.
🛈
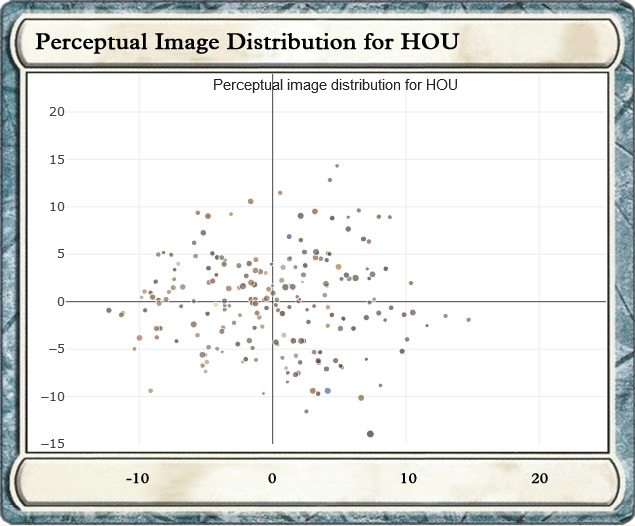
In contrast, Hour of Devastation (HOU, 2017, 🎴), where the planeswalkers fail, is actually one of the brightest, most pastel sets since the time of Legends. It also features a similar amount of art scatter as Apocalypse.
🛈
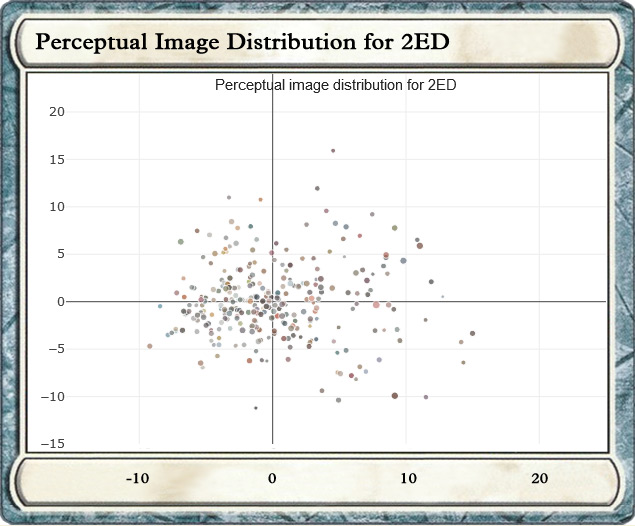
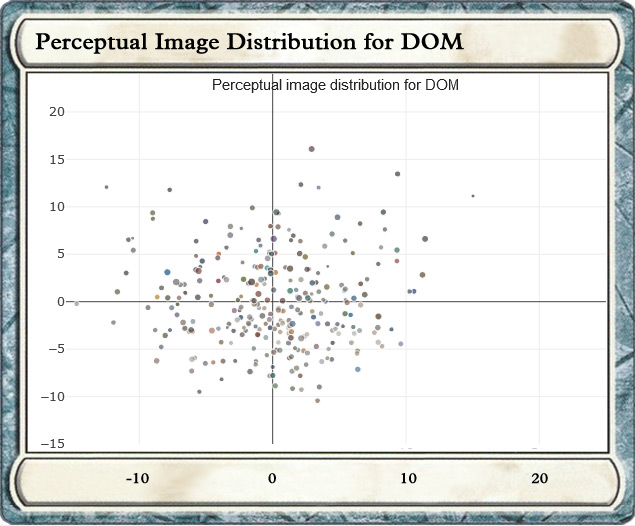
Finally, a view of the most recent set (at 2018), Dominaria (DOM, 2018, 🎴), which continues the pastel trend and diverse art assets. Compared to most of the core sets like the initial 2nd / Unlimited Edition (2ED, 93, 🎴) example I showed (representative of most core sets), it is spread out quite evenly with lots of diversity in the form and coloring of the art.