This is a 30+ image album breakdown of the 80's to 90's Star Trek shows, created by me in 2015, based on the user ratings of episodes (TV.com / IMDB), the Nielson ratings of the shows, and the largely user generated episode synopses on TV.com and Wikipedia (looking for word frequency and association with ratings).
After having gone through a rewatch of Trek's high points, and guiding a lot of that watch on the recommendations of social media, I started to be curious how user ratings and commercial ratings like Nielson's interacted with the shows.
Other data looks at: the Nielson's for shows in isolation, Nielson for TNG seasons, ratings by characters (main, support, guest), by settings and plot threads, by directors, and by writers, as well as some other visualizations to show relative ratings of groups.
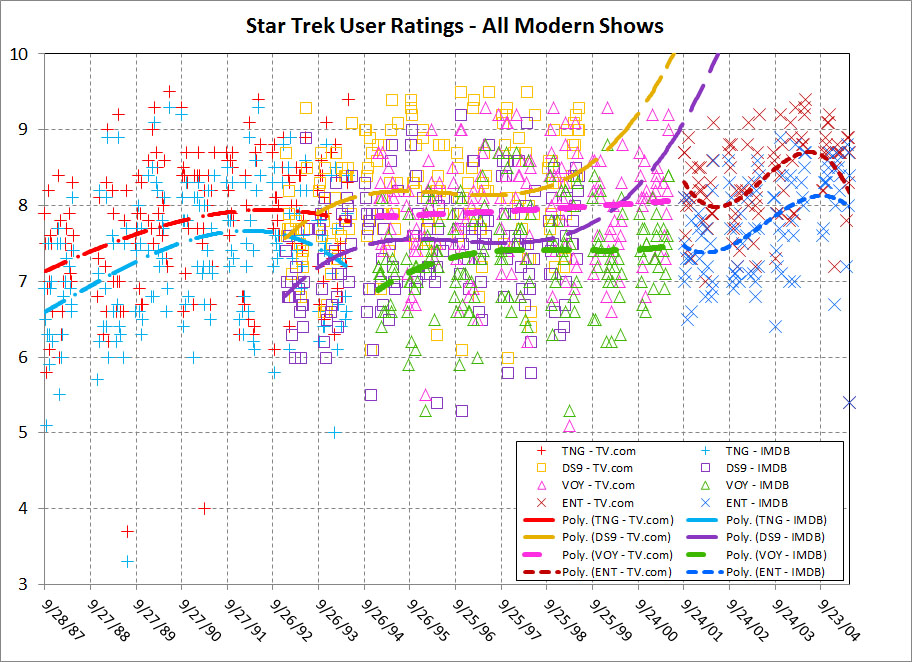
This first picture is just a bulk plot of the user ratings for all episodes of all Trek shows from the 80's to 00's era of Star Trek (TNG, DS9, VOY, ENT) with simple curve fits to the rating trends.
2015
🚀 Nielson Ratings, All Shows
🕵🏻
G. C. Putnam
🛈
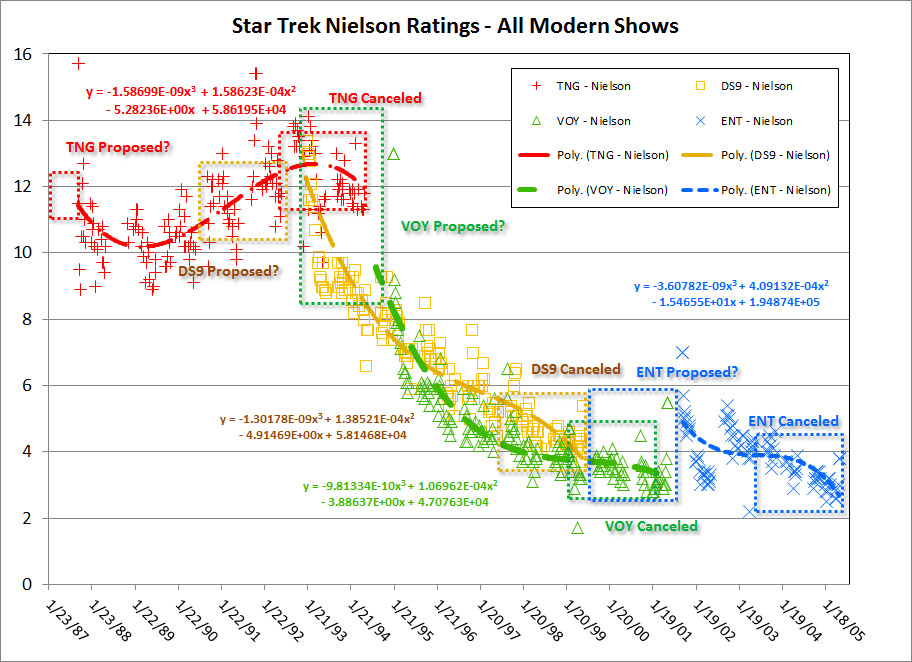
For this particular picture, I'm looking at the lifetime Nielson ratings for the 80' - 00's era of Star Trek (TNG, DS9, VOY, ENT), fitting simple curve fits to the data to look at how its trending, and then trying to highlight some of the data that may have led to shows getting pitched or canned.
🛈
Notes from Reddit folks:
Many shows were not cancelled, but rather the production crew decided to quit making the show.
TNG and DS9 were syndicated while VOY and ENT were network
TNG and DS9 were [possibly stopped] because of the business model in place at the time, wherein a show became more costly to produce in syndication with each new season, thereby making it too expensive to keep on the air after seven seasons.
🛈
Responses and Other Observations:
There is a visible trend where each show switches from 2nd order positive curvature (up) to second order negative curvature (down) near the end of their life (maybe why they quit/were canned)
While TNG and DS9 were both created for syndication, TNG remained flat / up for most of its life while DS9 started with TNG's audience and then dropped off a cliff. It basically went into free-fall and never recovered. If it had kept going, it would have been at VOY / UPN levels.
Further, VOY then started with audience part way down the slope, and followed nearly the exact-same-path as DS9 in the ratings. By mid-way through their lives they're entwined and look like a helix.
You could also, without much challenge, make an easy curve fit hitting nearly every show's Nielsens with a single line. That says to me that there's more than just syndication issues going on. That's more like your whole audience base is shifting (possibly TV's greater shift, maybe you just lost the "hot, talked about show" trait.)
The general shift for network vs not doesn't seem as pronounced as you would think. The shift honestly looks like about a flat 1-2 Nielsen point bias between syndication vs network if I just compare DS9 to VOY and look at their curves. That's not nearly the story of the woeful performance of the crummy network. That's 4 network vs 5-6 in syndication.
2015
🚀 The Original Series, User Ratings (IMDB, TV.com), All Seasons
🕵🏻
G. C. Putnam
🛈
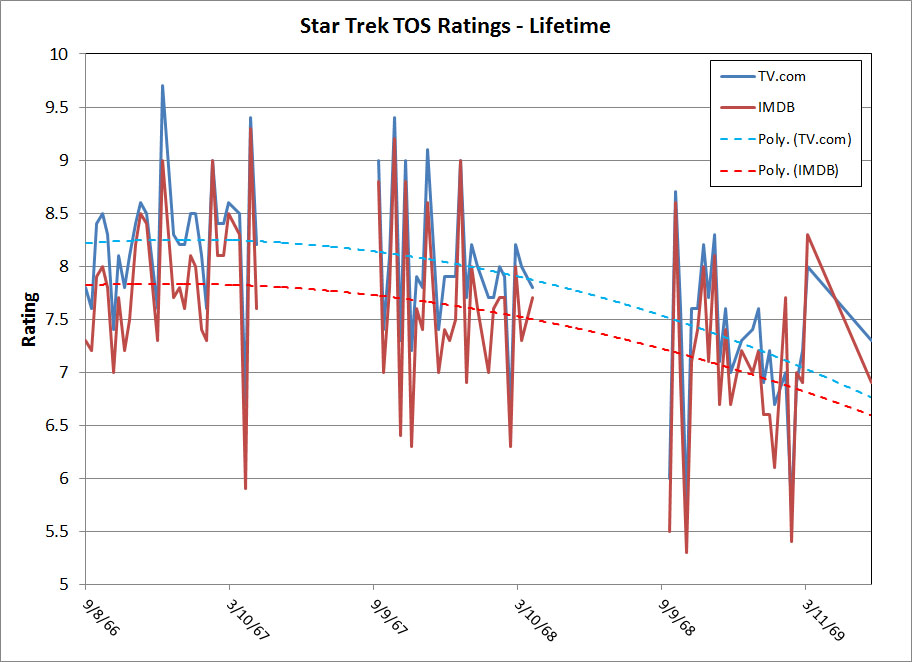
User ratings for Star Trek: The Original Series on TV.com and IMDB. No Nielson ratings could be found.
2015
🚀 The Next Generation, Ratings (Nielson, IMDB, TV.com), All Seasons
🕵🏻
G. C. Putnam
🛈
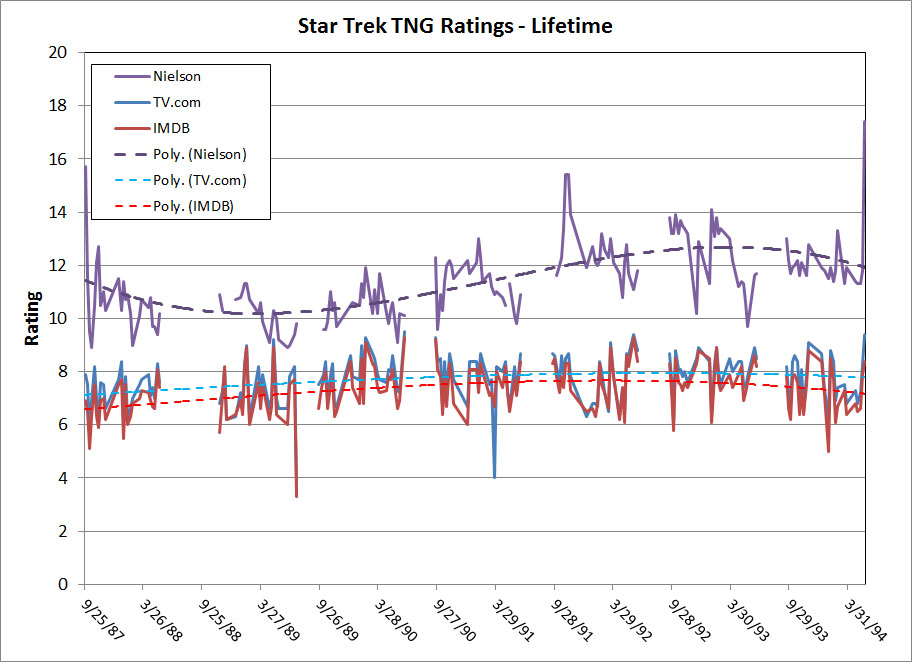
User ratings for Star Trek: The Next Generation on TV.com and IMDB along with Nielson ratings.
2015
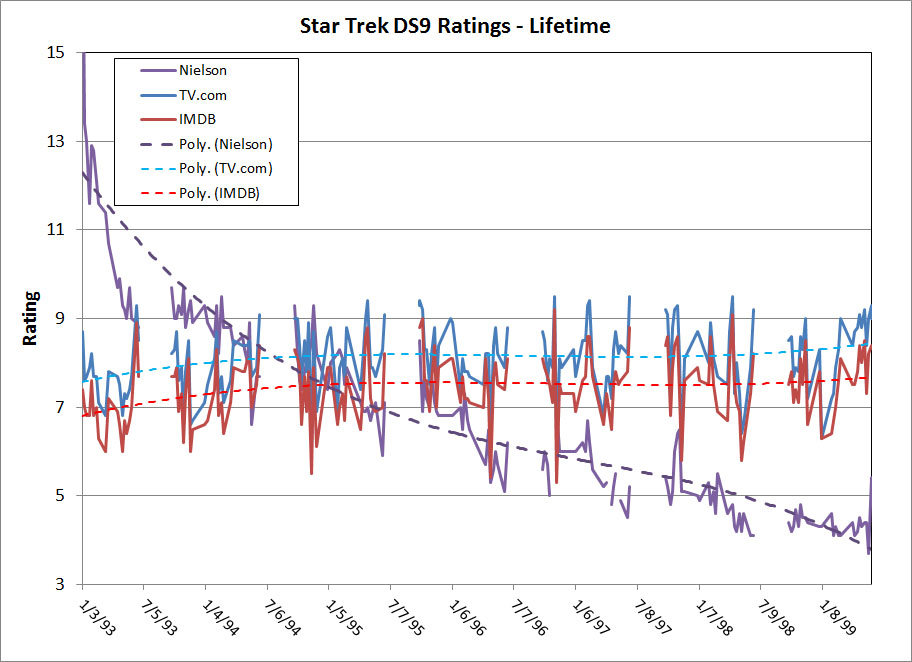
🚀 Deep Space Nine, Ratings (Nielson, IMDB, TV.com), All Seasons
🕵🏻
G. C. Putnam
🛈
User ratings for Star Trek: Deep Space Nine on TV.com and IMDB along with Nielson ratings.
2015
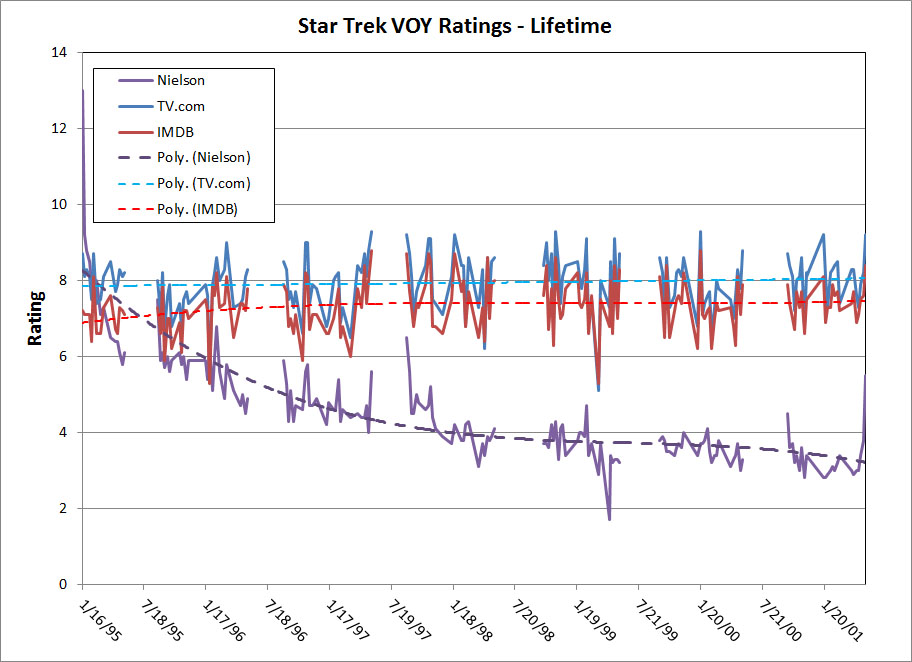
🚀 Voyager, Ratings (Nielson, IMDB, TV.com), All Seasons
🕵🏻
G. C. Putnam
🛈
User ratings for Star Trek: Voyager on TV.com and IMDB along with Nielson ratings.
2015
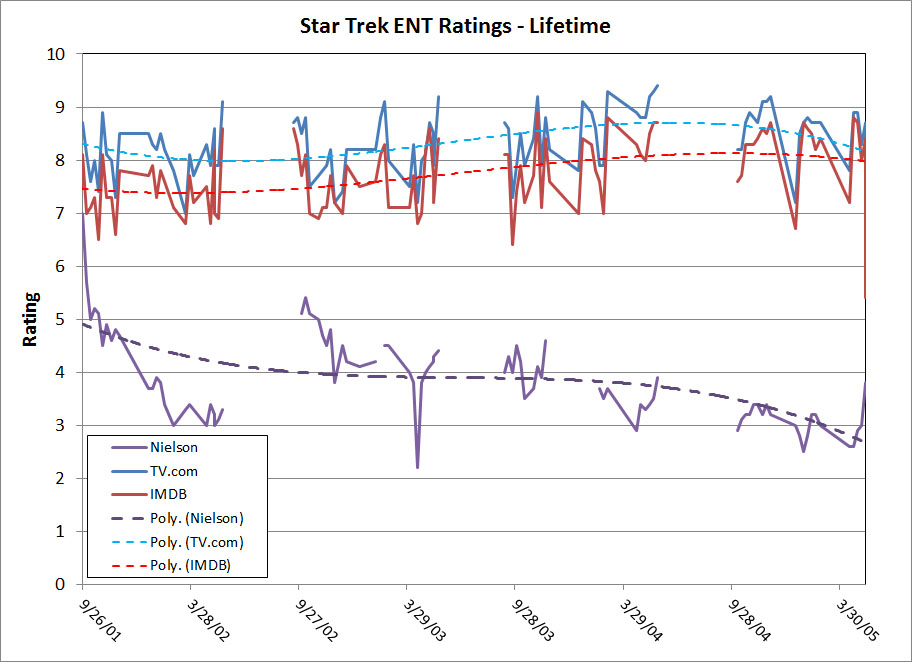
🚀 Enterprise, Ratings (Nielson, IMDB, TV.com), All Seasons
🕵🏻
G. C. Putnam
🛈
User ratings for Star Trek: Enterprise on TV.com and IMDB along with Nielson ratings.
2015
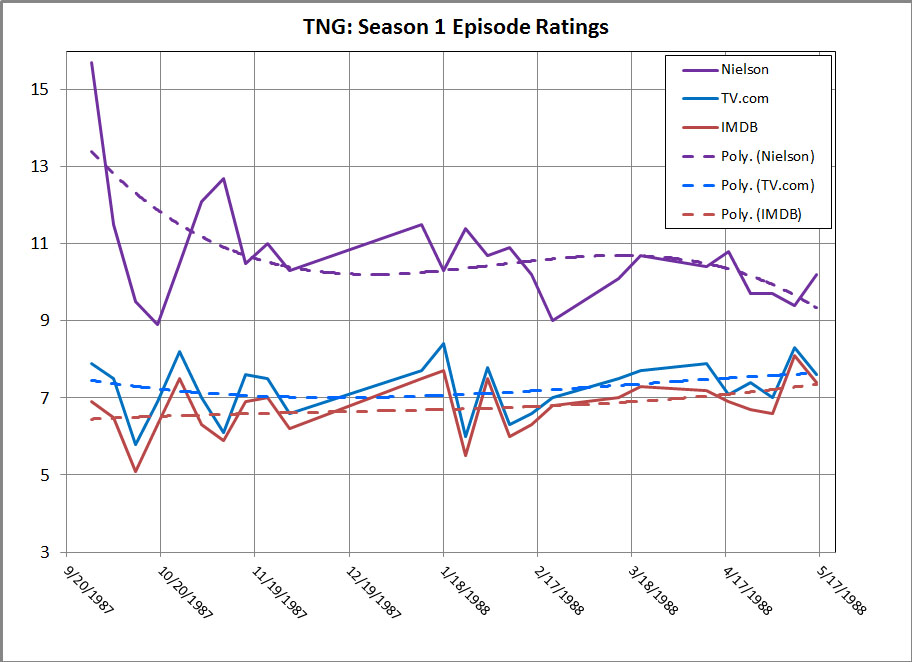
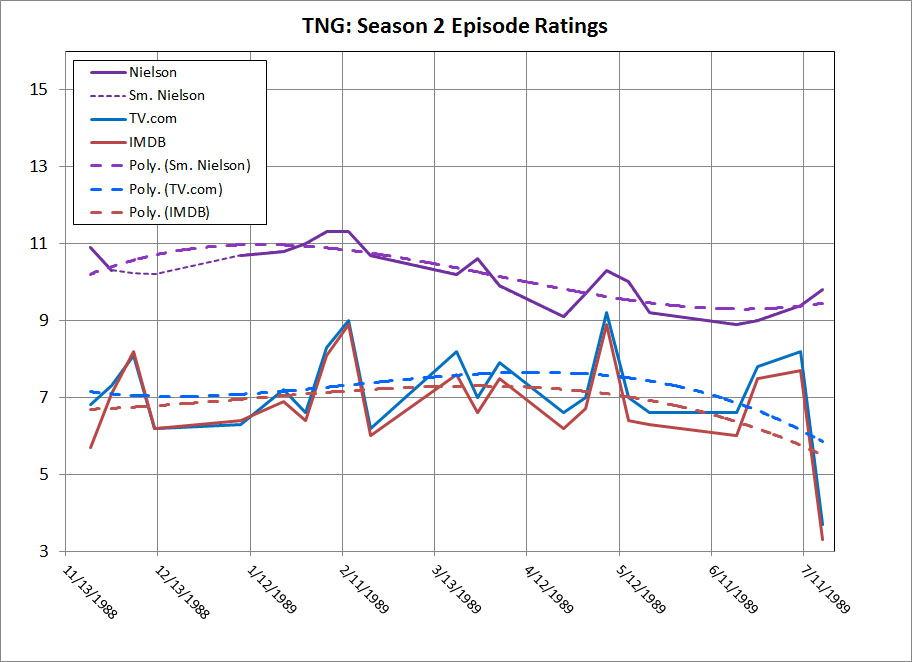
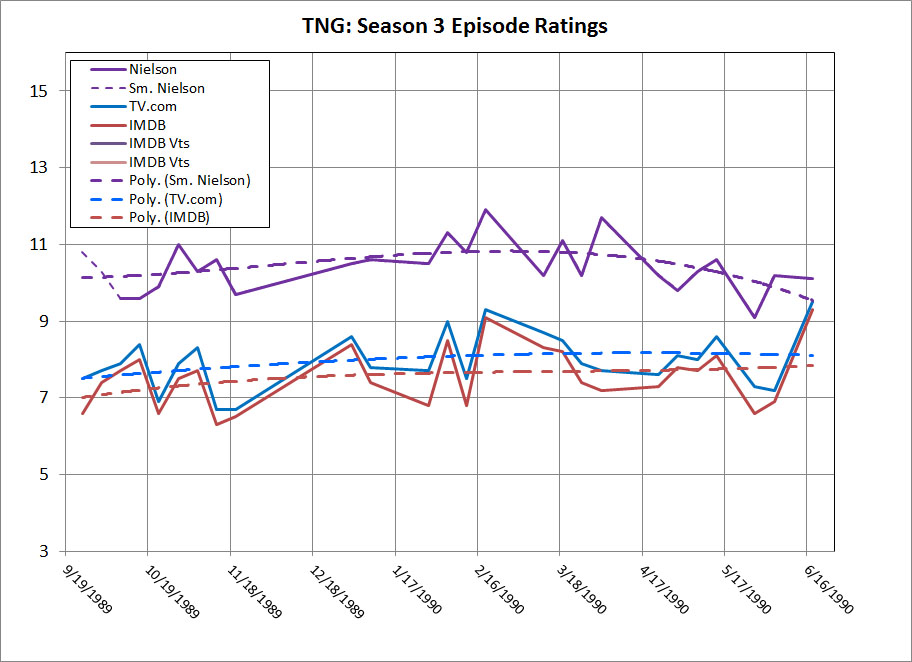
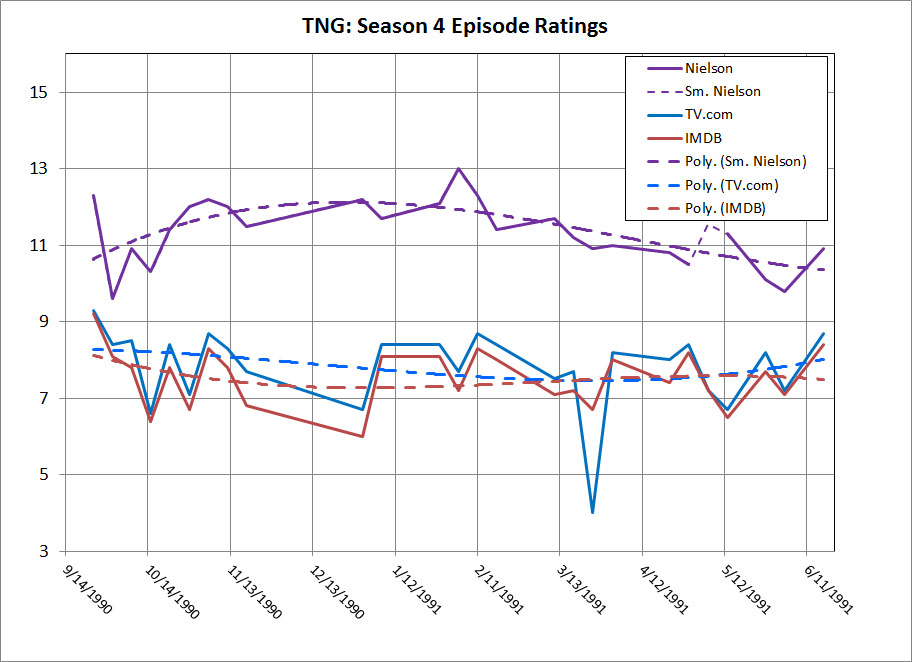
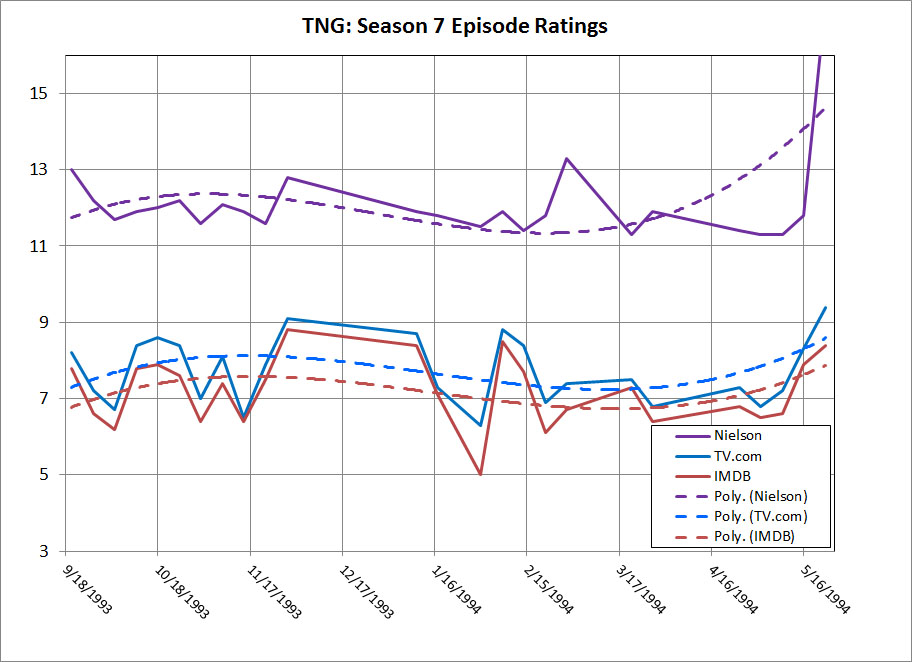
🚀 The Next Generation, Ratings (Nielson, IMDB, TV.com), Season 1-7
🕵🏻
G. C. Putnam
🛈
Zoomed in view of user ratings for Star Trek: The Next Generation Season 1-7 on TV.com and IMDB along with Nielson ratings.
2015
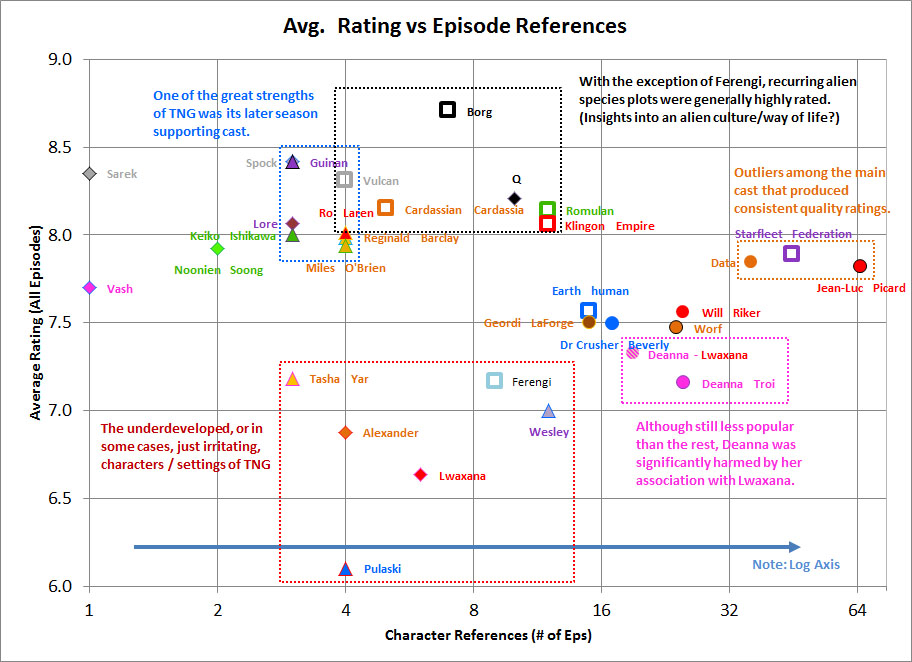
🚀 The Next Generation, Characters, Antagonists, and Settings - Ratings vs References
🕵🏻
G. C. Putnam
🛈
Plot of the various characters common to TNG and how they rate on average with viewers for their episodes.
2015
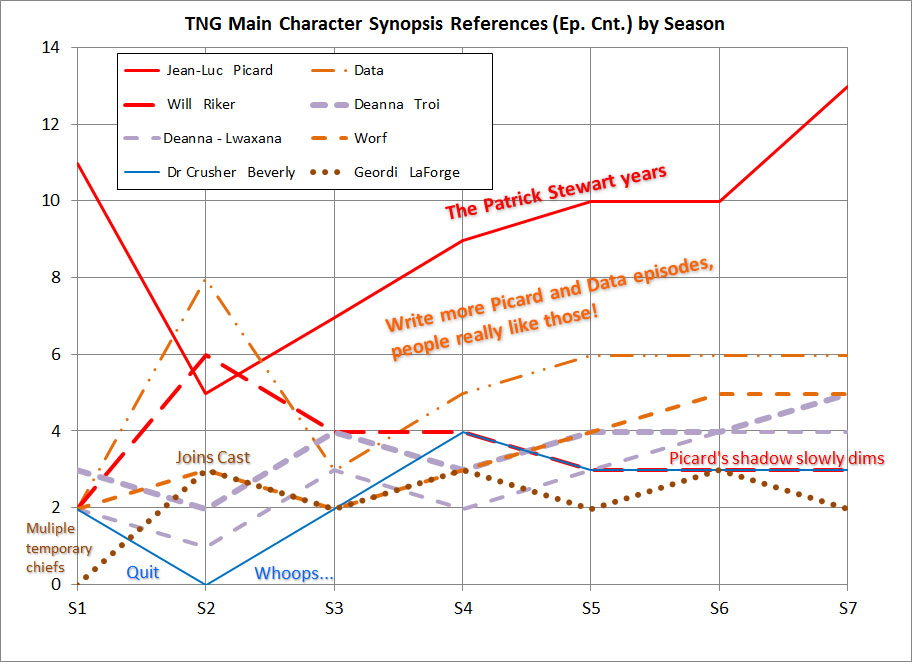
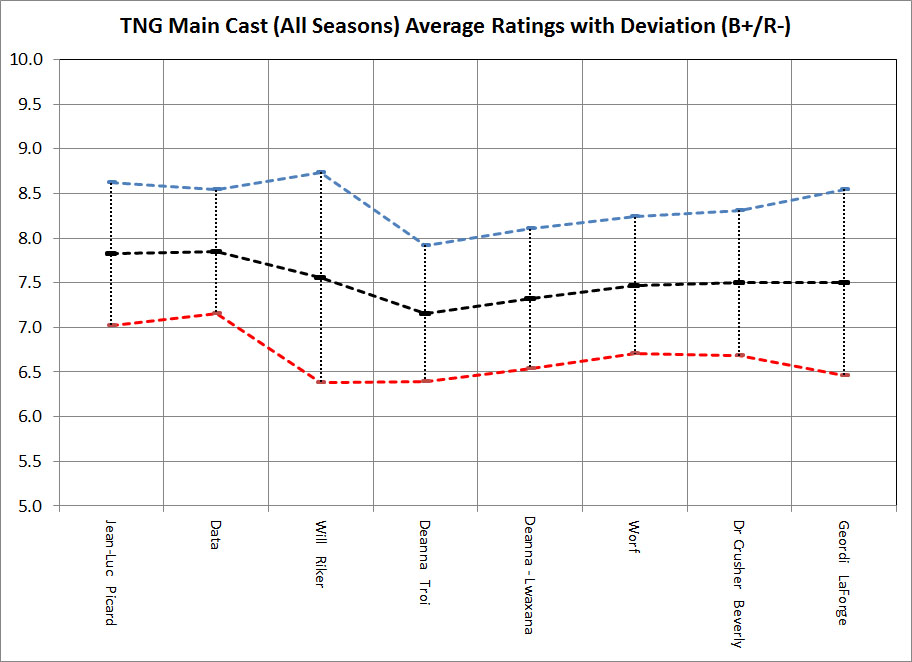
🚀 The Next Generation, Main Cast References / Season and Average Appearance User Rating with Deviations
🕵🏻
G. C. Putnam
🛈
These plots graph the main cast appearances and average rating per cast member. Episode summaries on Wikipedia, IMDB, and TV.com were searched for a given keyword, in this case, the names of the main cast. The first chart is the number of episodes which directly reference a main cast character in the synopsis on wikipedia or TV.com and then showed how they trend over the seasons of the show. For the second chart, all episodes associated with those words had their ratings averaged, and then that rating is plotted here with the standard deviation up / down.
2015
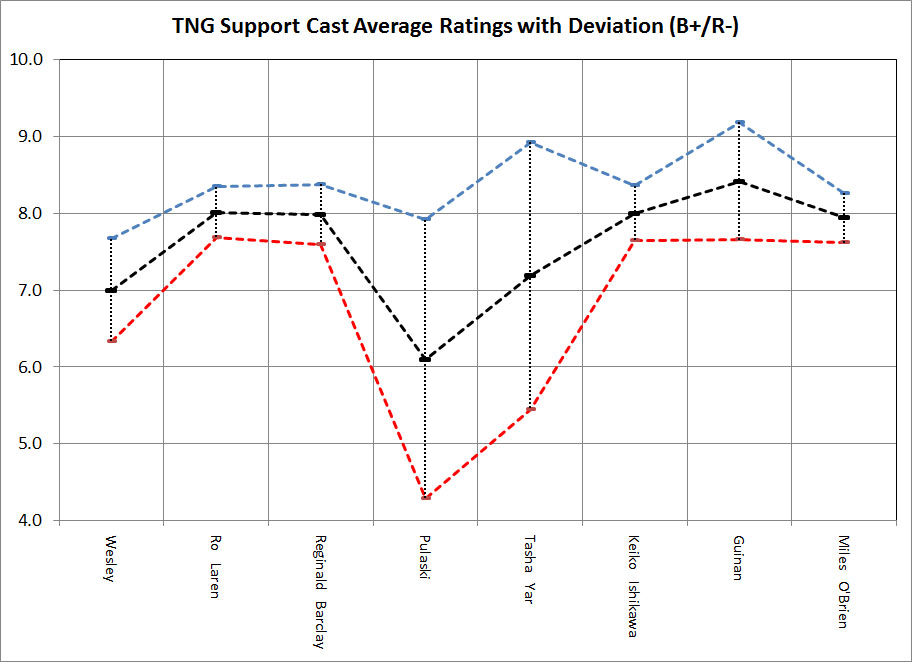
🚀 The Next Generation, Supporting Cast, References / Season and Average Appearance User Rating with Deviations
🕵🏻
G. C. Putnam
🛈
These plots graph the supporting cast appearances and average rating per cast member. Episode summaries on Wikipedia, IMDB, and TV.com were searched for a given keyword, in this case, the names of the supporting cast. The first chart is the number of episodes which directly reference a supporting cast character in the synopsis on wikipedia or TV.com and then showed how they trend over the seasons of the show. For the second chart, all episodes associated with those words had their ratings averaged, and then that rating is plotted here with the standard deviation up / down.
2015
🚀 The Next Generation, Guest Cast, References / Season and Average Appearance User Rating with Deviations
🕵🏻
G. C. Putnam
🛈
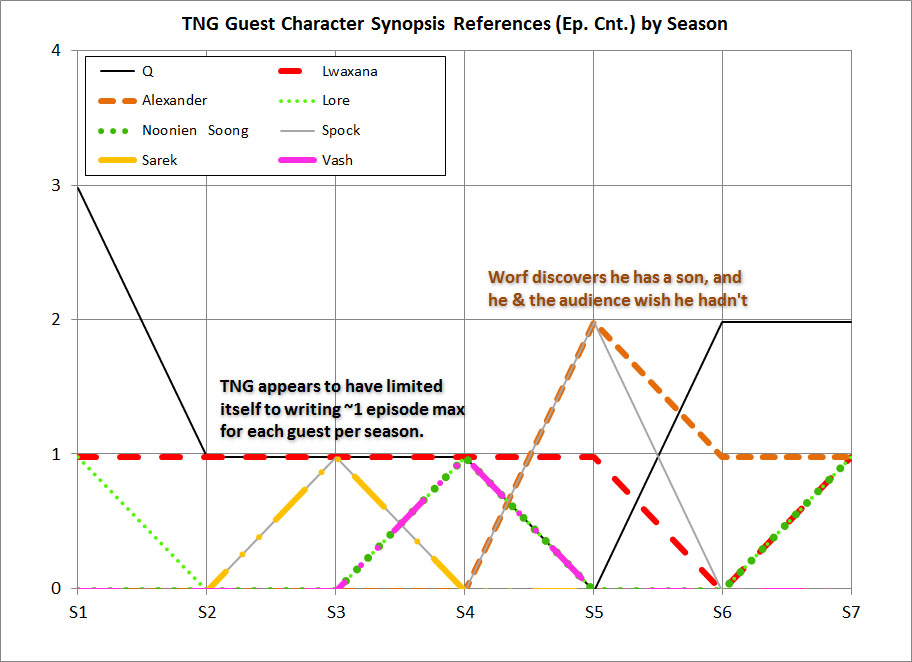
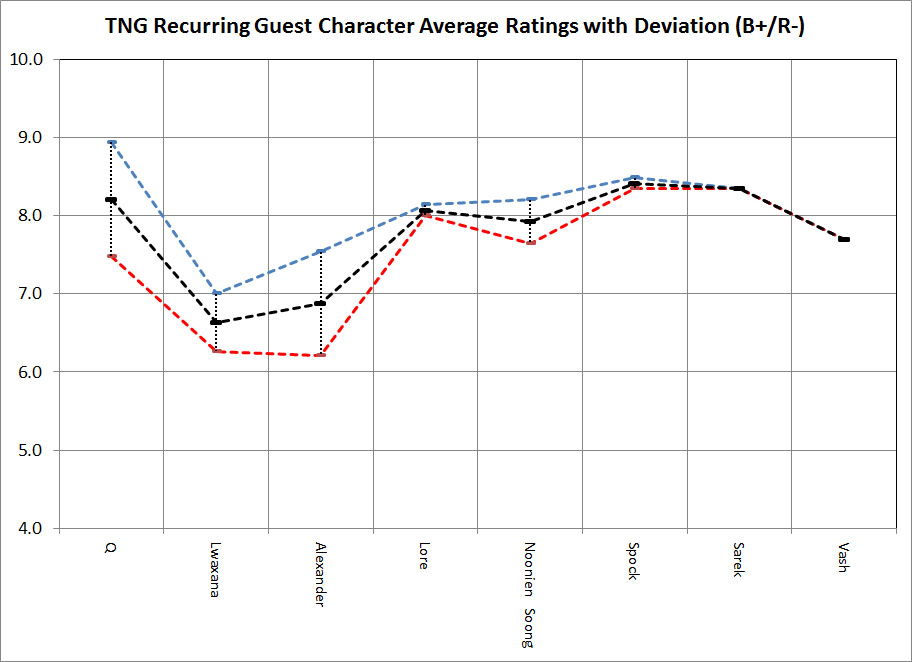
These plots graph the guest cast appearances and average rating per cast member. Episode summaries on Wikipedia, IMDB, and TV.com were searched for a given keyword, in this case, the names of the guest cast. The first chart is the number of episodes which directly reference a guest cast character in the synopsis on wikipedia or TV.com and then showed how they trend over the seasons of the show. For the second chart, all episodes associated with those words had their ratings averaged, and then that rating is plotted here with the standard deviation up / down.
2015
🚀 The Next Generation, Settings or Antagonist, References / Season and Average Appearance User Rating with Deviations
🕵🏻
G. C. Putnam
🛈
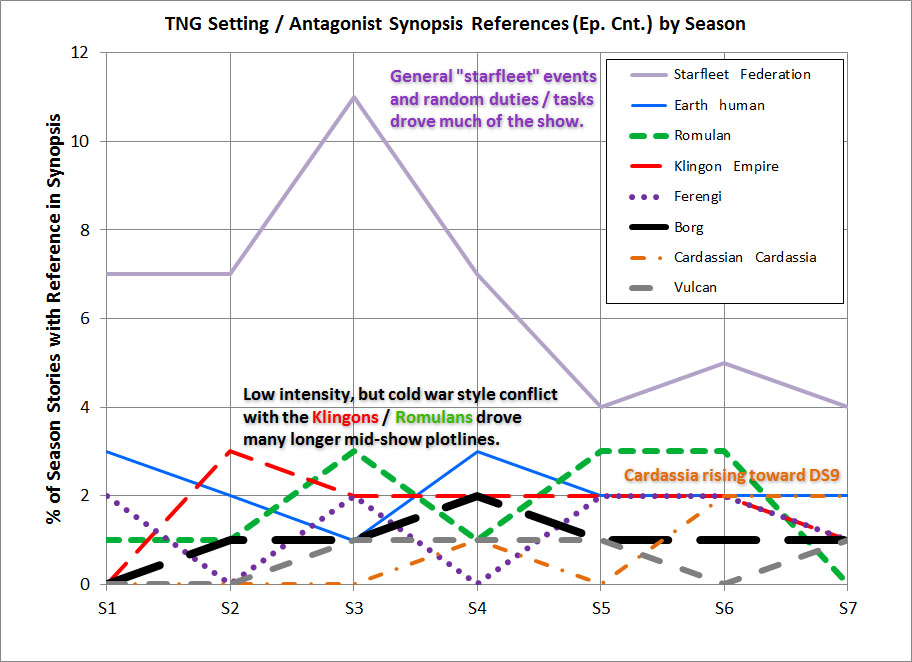
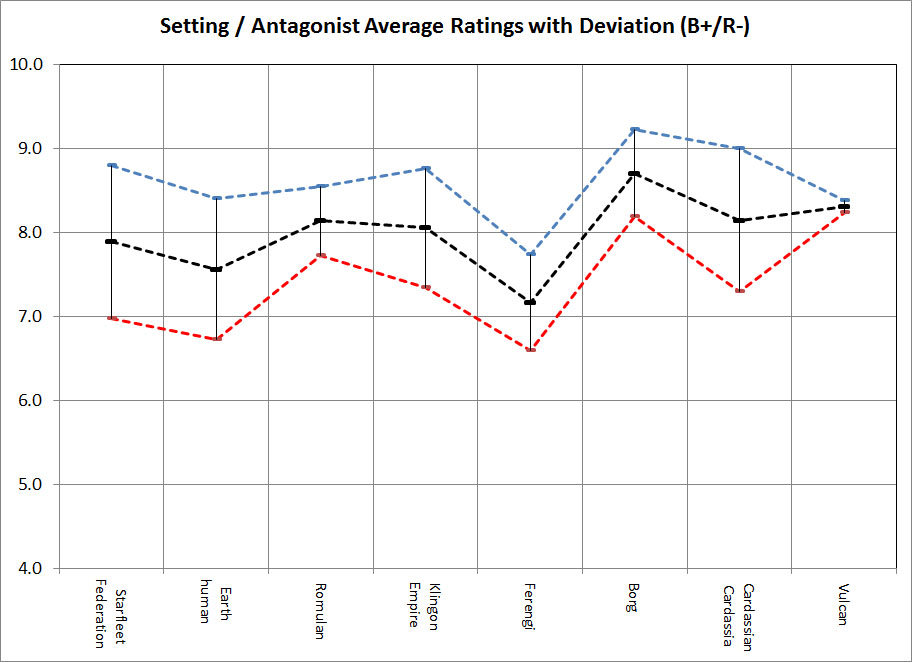
These plots graph the settings or antagonist appearances and average rating per cast member. Episode summaries on Wikipedia, IMDB, and TV.com were searched for a given keyword, in this case, the names of the settings or antagonist. The first chart is the number of episodes which directly reference a settings or antagonist in the synopsis on wikipedia or TV.com and then showed how they trend over the seasons of the show. For the second chart, all episodes associated with those words had their ratings averaged, and then that rating is plotted here with the standard deviation up / down.
2015
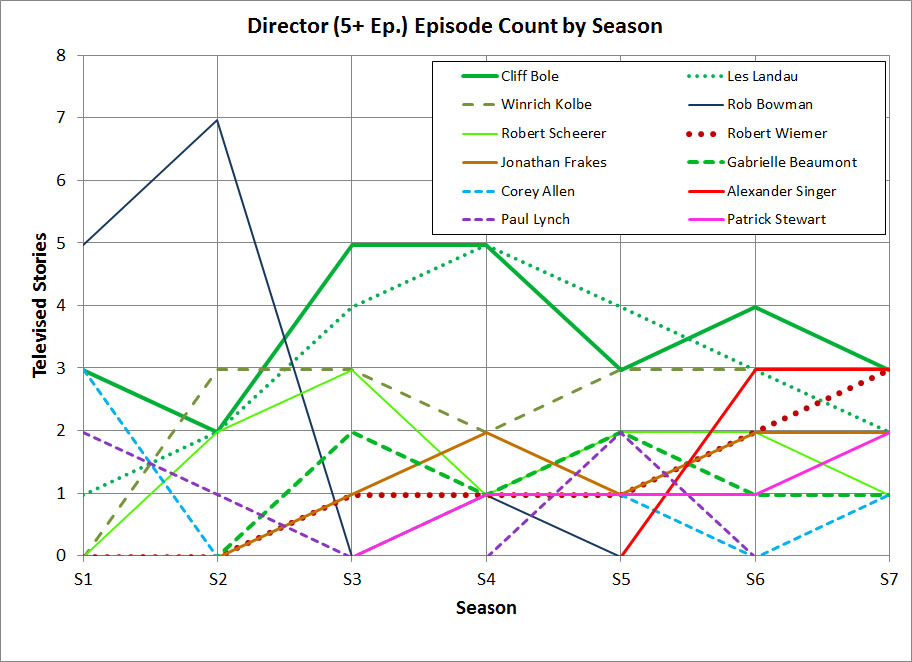
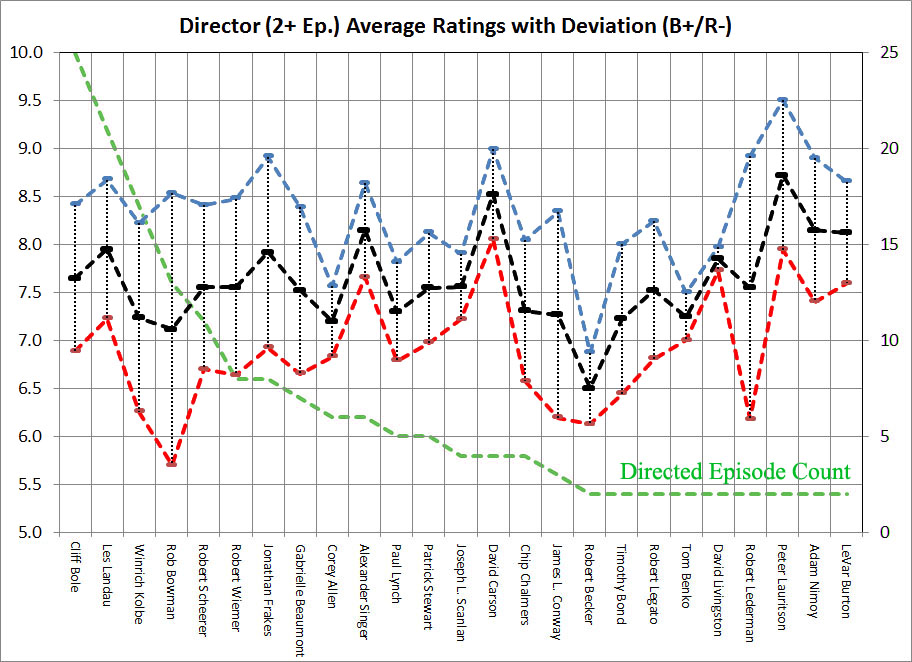
🚀 The Next Generation, Directors, References / Season and Average Appearance User Rating with Deviations
🕵🏻
G. C. Putnam
🛈
These plots graph the director participation (2+ episodes minimum) and average rating per show they worked on. Episode summaries on Wikipedia, IMDB, and TV.com were searched for a given keyword, in this case, the names of the director. The first chart is the number of episodes which directly reference a director in the synopsis on wikipedia or TV.com and then showed how they trend over the seasons of the show. For the second chart, all episodes associated with those words had their ratings averaged, and then that rating is plotted here with the standard deviation up / down.
2015
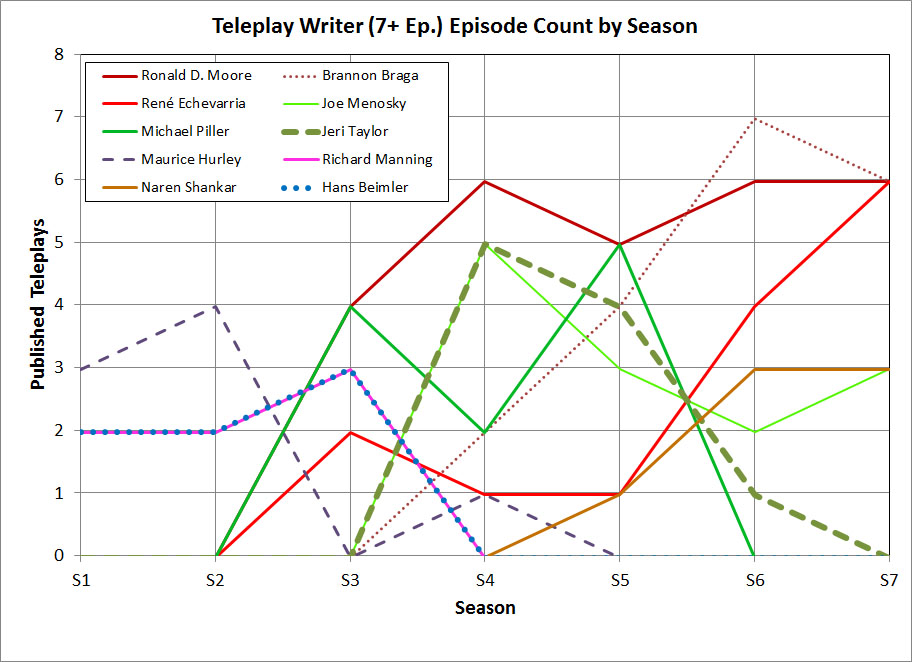
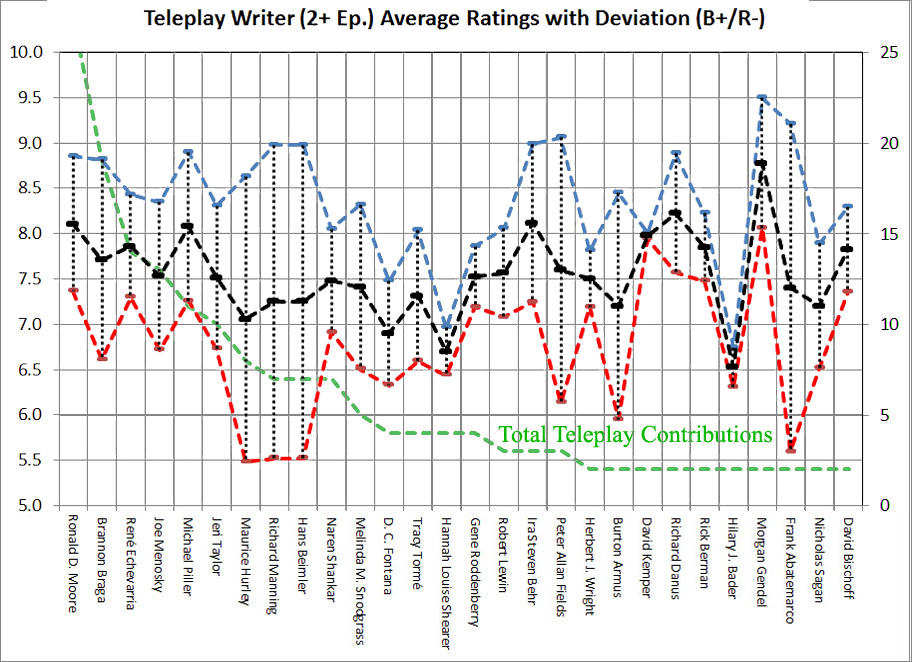
🚀 The Next Generation, Writers for Teleplays, References / Season and Average Appearance User Rating with Deviations
🕵🏻
G. C. Putnam
🛈
These plots graph the writers for teleplay participation (2+ episodes minimum) and average rating per show they worked on. Episode summaries on Wikipedia, IMDB, and TV.com were searched for a given keyword, in this case, the names of the writer. The first chart is the number of episodes which directly reference a writer in the synopsis on wikipedia or TV.com and then showed how they trend over the seasons of the show. For the second chart, all episodes associated with those words had their ratings averaged, and then that rating is plotted here with the standard deviation up / down.
2015
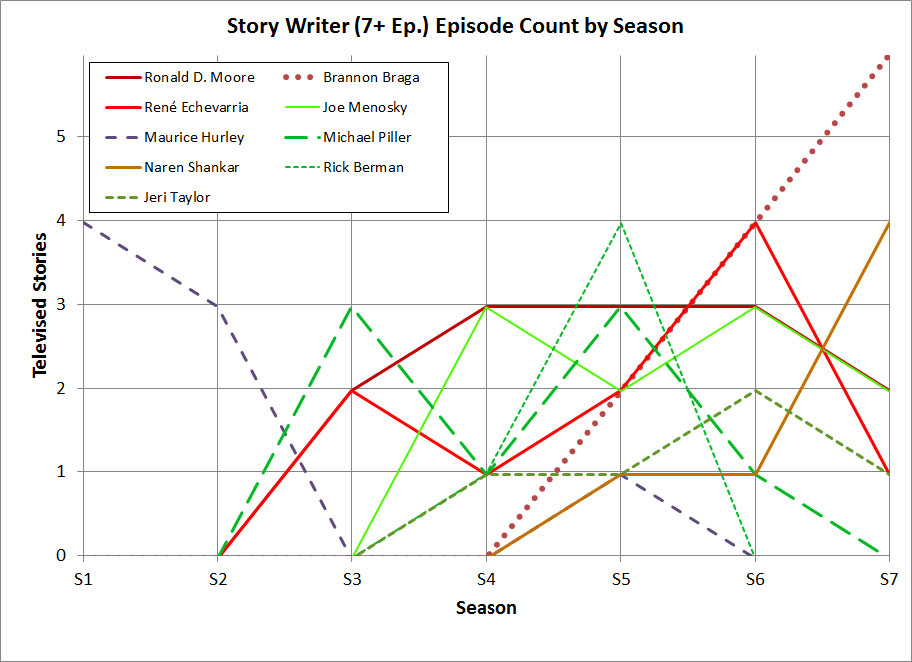
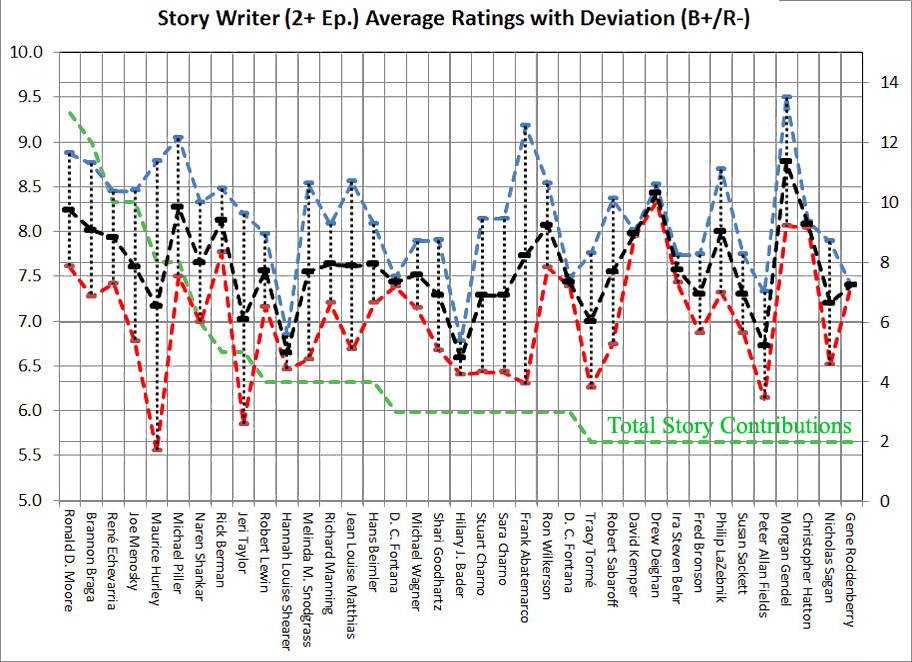
🚀 The Next Generation, Writers for Story, References / Season and Average Appearance User Rating with Deviations
🕵🏻
G. C. Putnam
🛈
These plots graph the writers for story participation (2+ episodes minimum) and average rating per show they worked on. Episode summaries on Wikipedia, IMDB, and TV.com were searched for a given keyword, in this case, the names of the writer. The first chart is the number of episodes which directly reference a writer in the synopsis on wikipedia or TV.com and then showed how they trend over the seasons of the show. For the second chart, all episodes associated with those words had their ratings averaged, and then that rating is plotted here with the standard deviation up / down.